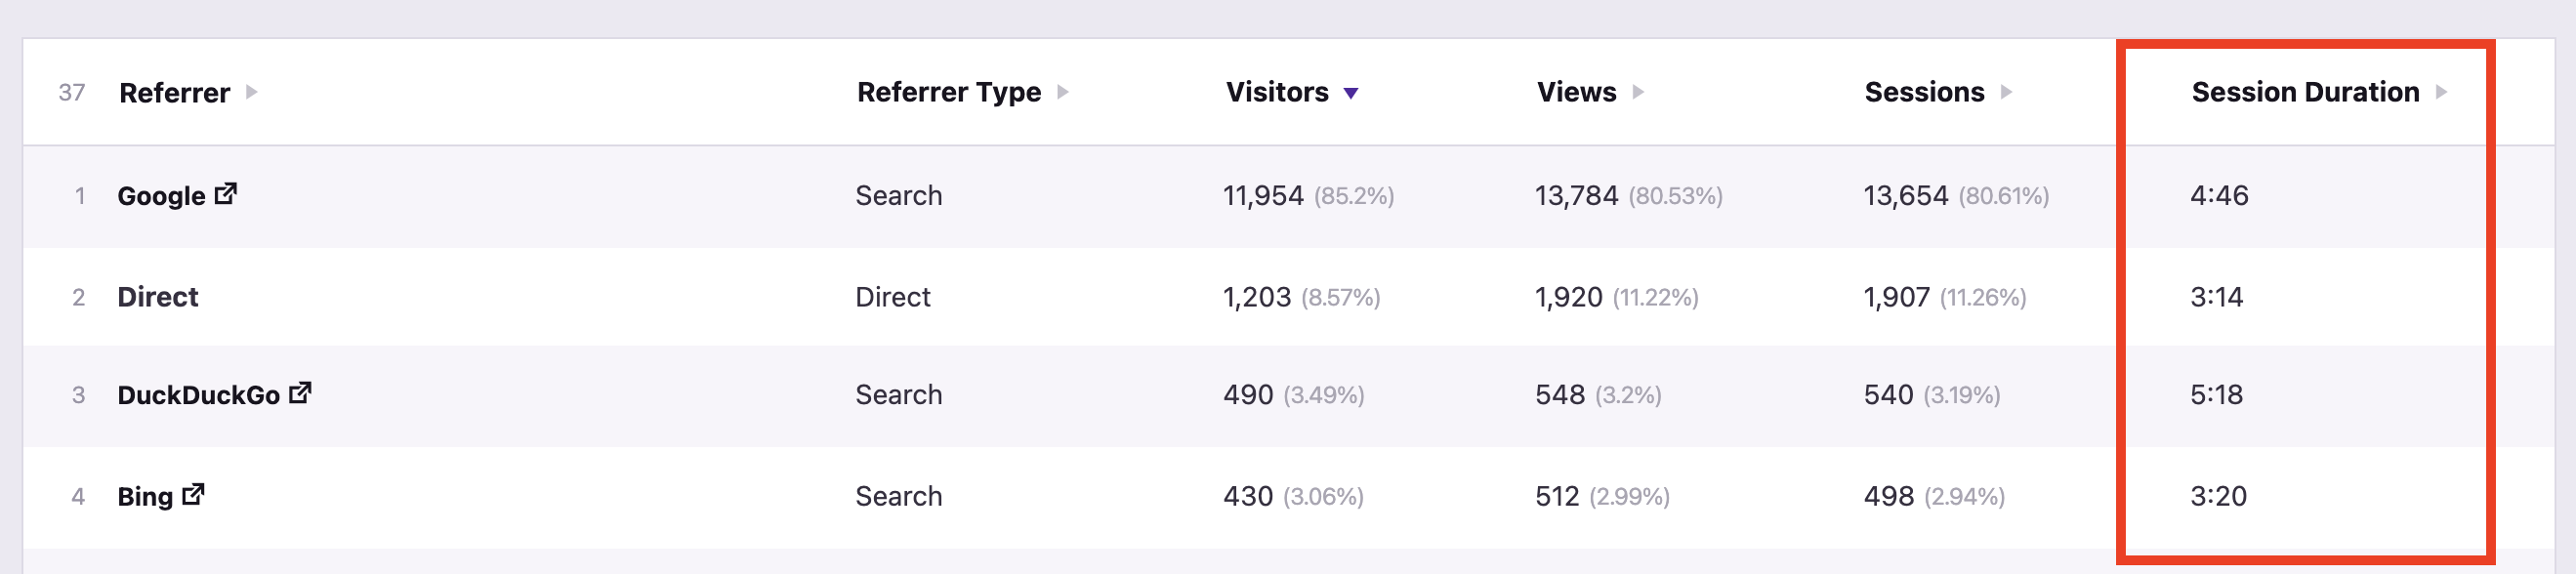
Session Duration tells you how long people spend on your site when they visit, on average. This metric appears in the Quick Stats of each page, and it also shows up in the table for referrers, geolocations, and campaigns.
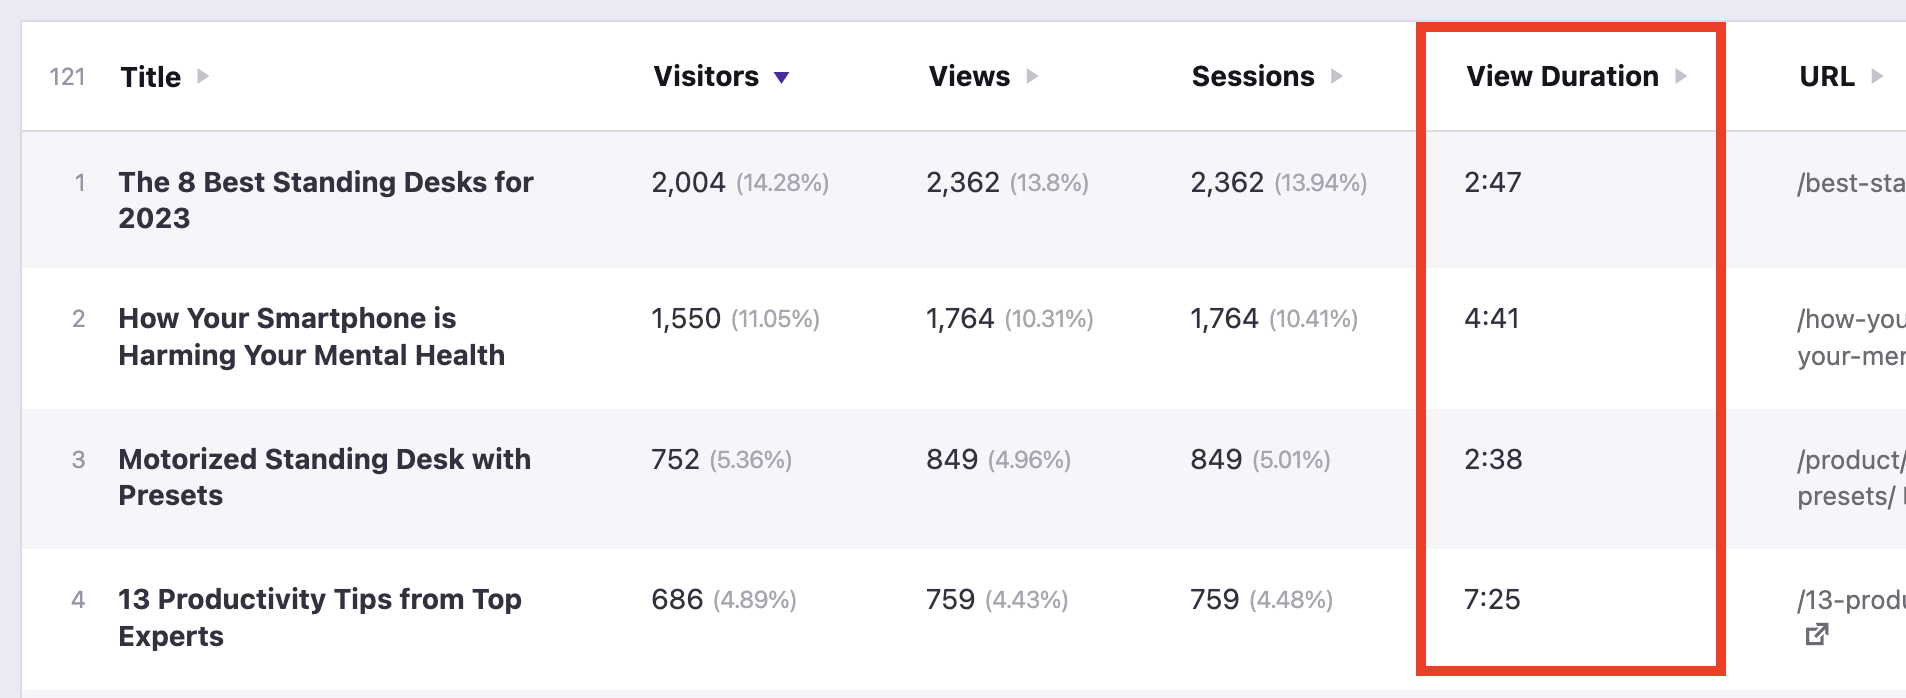
For the Pages menu, you'll see View Duration instead of Session Duration in the table. View Duration tells you how long visitors look at a page, on average.
Since these metrics are built off of our session-based tracking system, they're available retroactively. In other words, you can see Session Duration and View Duration for the past few months rather than starting today.
What else happened?
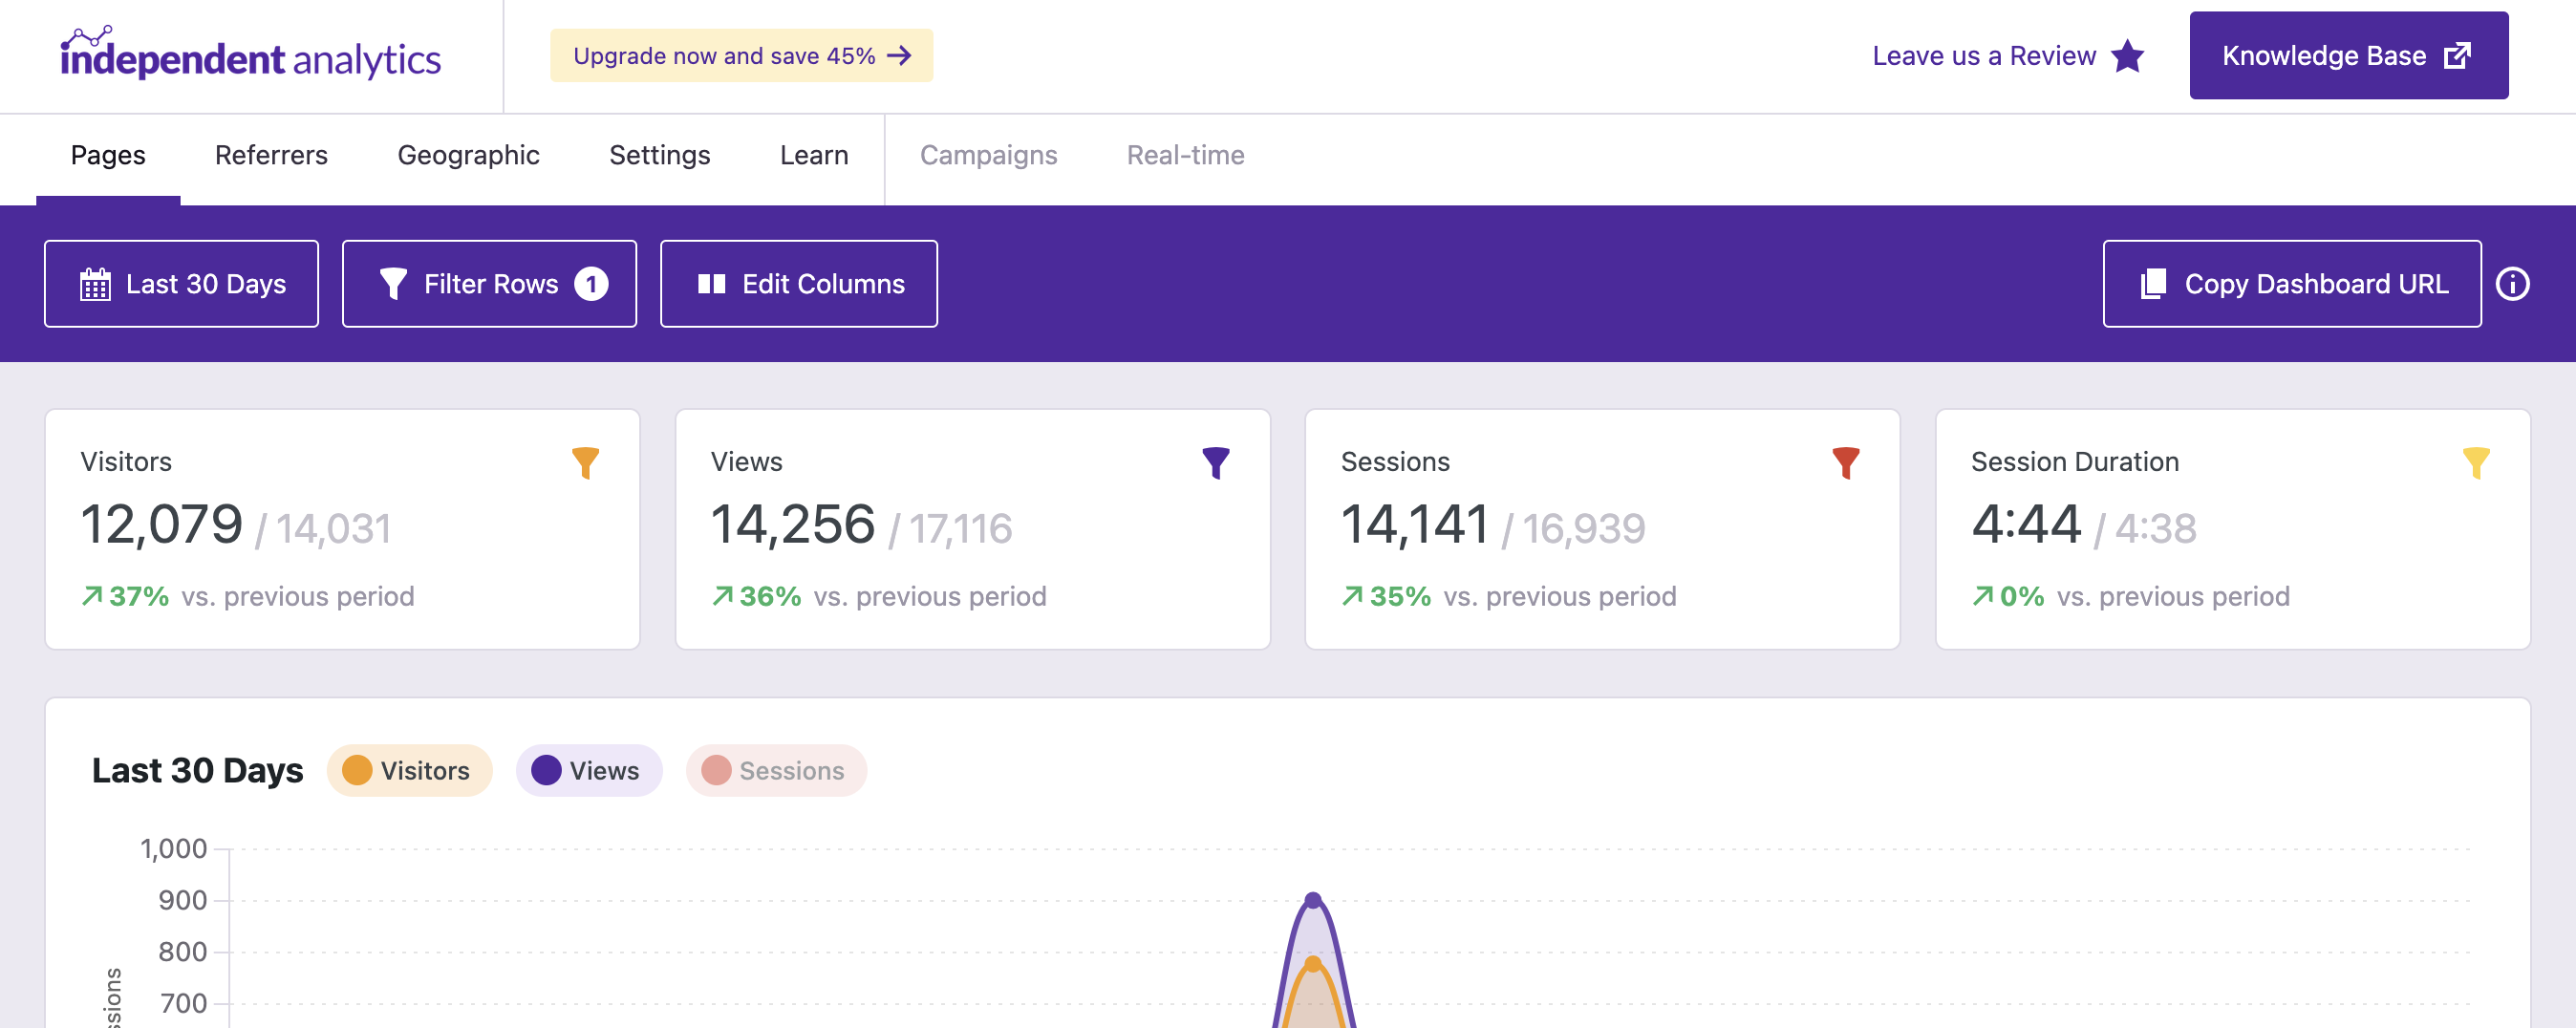
You'll also notice that the Quick Stats have a lighter font and new icon, but more importantly, the filtered values now show inside the same boxes rather than getting their own.
We found this to be a more visually pleasing and readable layout.
What you wouldn't guess from this update is that 90% of the changes didn't make it into the changelog. Our first crack at adding session duration exposed a weakness in our query design and slowed down the dashboard massively. There was an overhaul of this system, and after the refactor, we were able to include the new duration metrics without affecting performance negatively.
What's next?
Most of the top-voted requests here are for metrics, so we're going to keep our foot on the gas and include a handful more metrics before turning our attention to anything else.
Next up, we'll be adding Bounce Rate and Pages Per Session, so you can expect those in your dashboard soon!