Added 5 more pre-defined date ranges: Last 60 Days, Last 90 Days, Last 3 Months, Last 6 Months, and All Time
Added option to make view counter private
View counter can now display stats from all-time, today, last 30 days, this month, or last month
Added option to manually adjust view counter stats for individual posts
Added 4 more color options for email reports
The Admin Bar stats now include the “All Time” views for the page
Created new Help & Support page
Created new Updates page
Removed all non-report items from analytics sidebar
/temp/ directory can be now be defined via the IAWP_TEMP_DIR constant in wp-config.php
Added icons for more browser
Checking for missing database privileges and showing a warning message if missing INDEX, ALTER, or DROP
Add PDF tracking support for TNC FlipBook plugin
Added conflict notice when the REST API is blocked by the Admin & Site Enhancements plugin
Updated the IP-to-geolocation library for more accurate location tracking
Fixed 500 server error caused when updating custom taxonomies
Fixed conflict with Age Gate plugin
Filtering by category now works with posts that have multiple categories
Fixed bugs caused by text getting translated by WP
Fix for stylesheet issue coming from WP Media Files Name Rename plugin
POT file for translations wasn’t getting updated
Fixed IP blocking for IPv6 addresses and added wildcard support for them
Fixed compatibility issue with WP Ultimo coming from BladeOne library
Fixed Instagram and instagram.com showing up separately in Referrers menu
Fixed when the view counter was added to post previews, it was showing stats for the blog/archive page, not for each post.
Fixed error caused when Independent Analytics is deactivated, a database cleaning plugin deletes all the DB tables, and then Independent Analytics is reactivated. It now resets from scratch without error.
Fix to prevent collation mismatch errors during database migrations
Increased timeout values which will greatly reduce data migration errors during updates and also give high-traffic websites enough time to fully load their reports
After the massive 2.1 update, we're happy to have settled into a more regular update routine again. Update version 2.2 brings a variety of improvements, with these major changes, which we'll highlight here.
UI enhancements
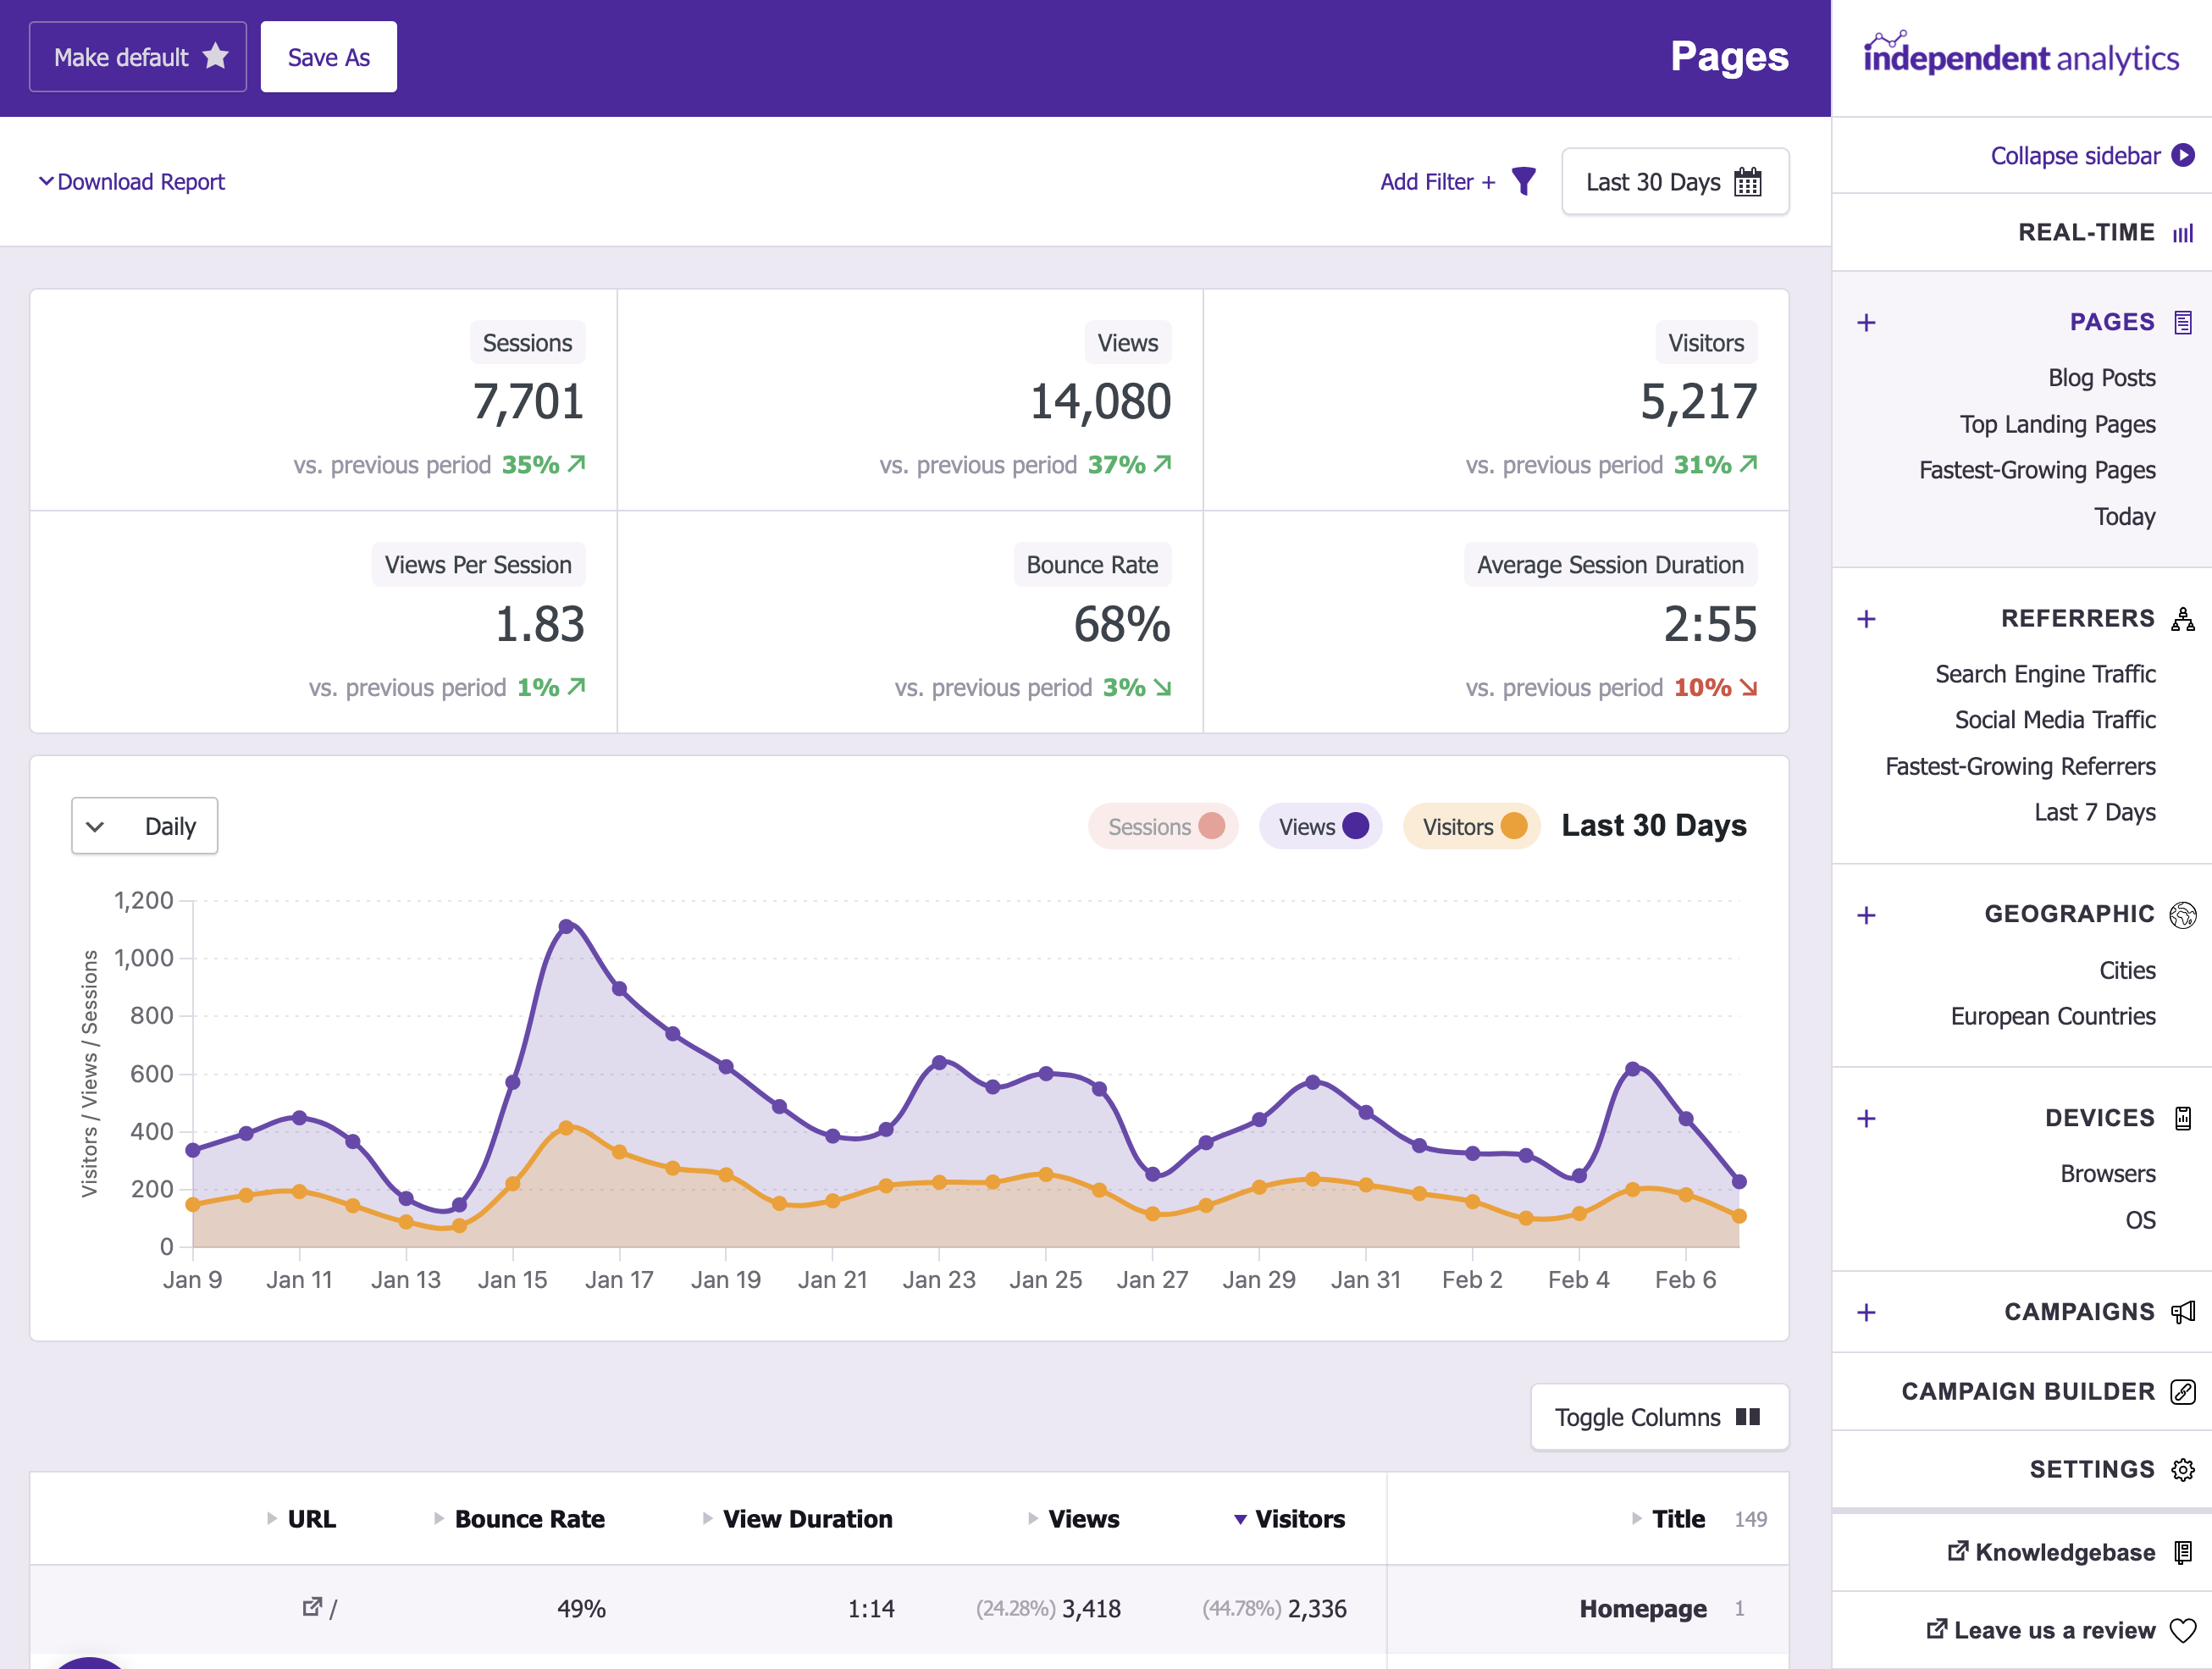
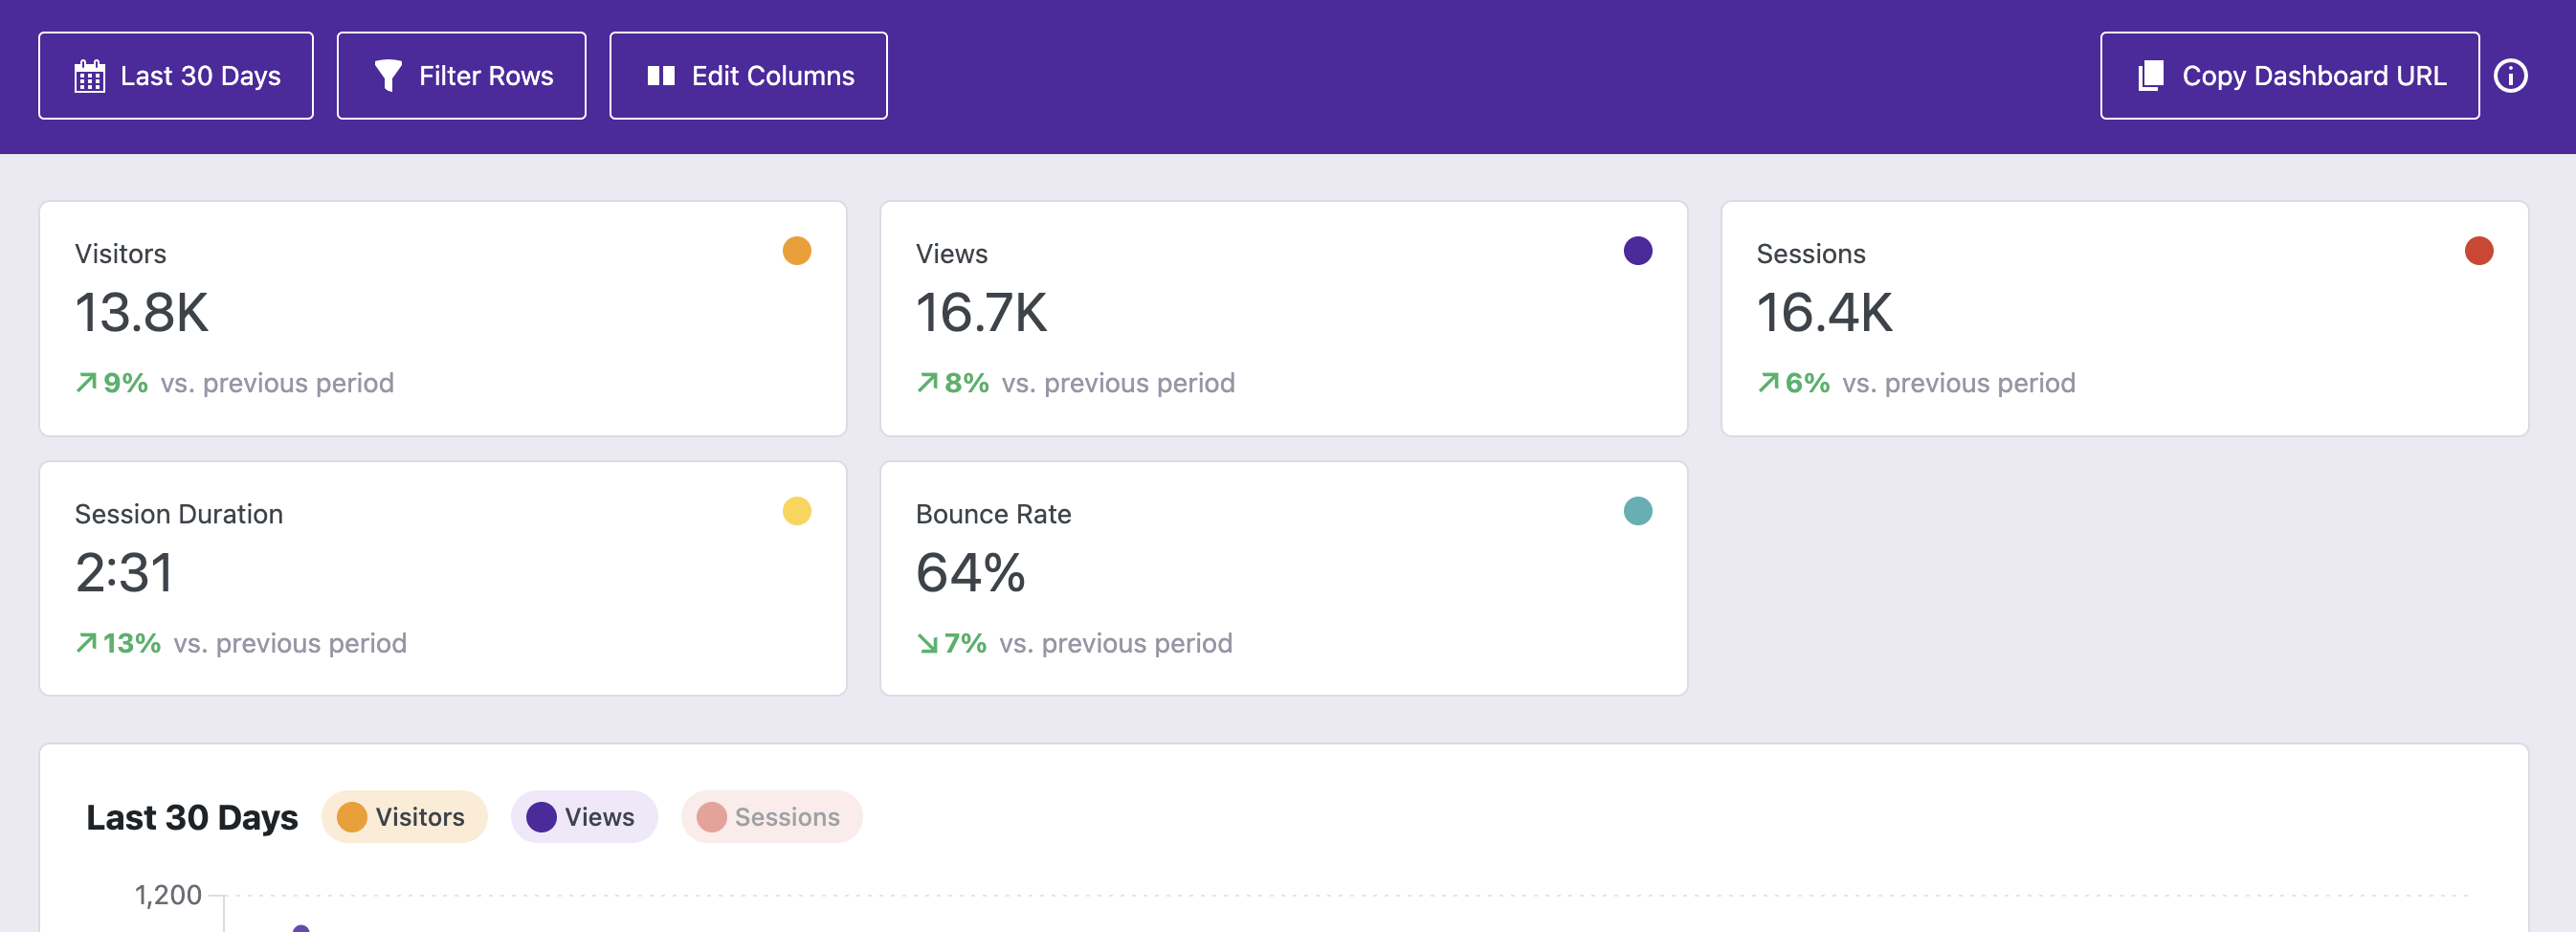
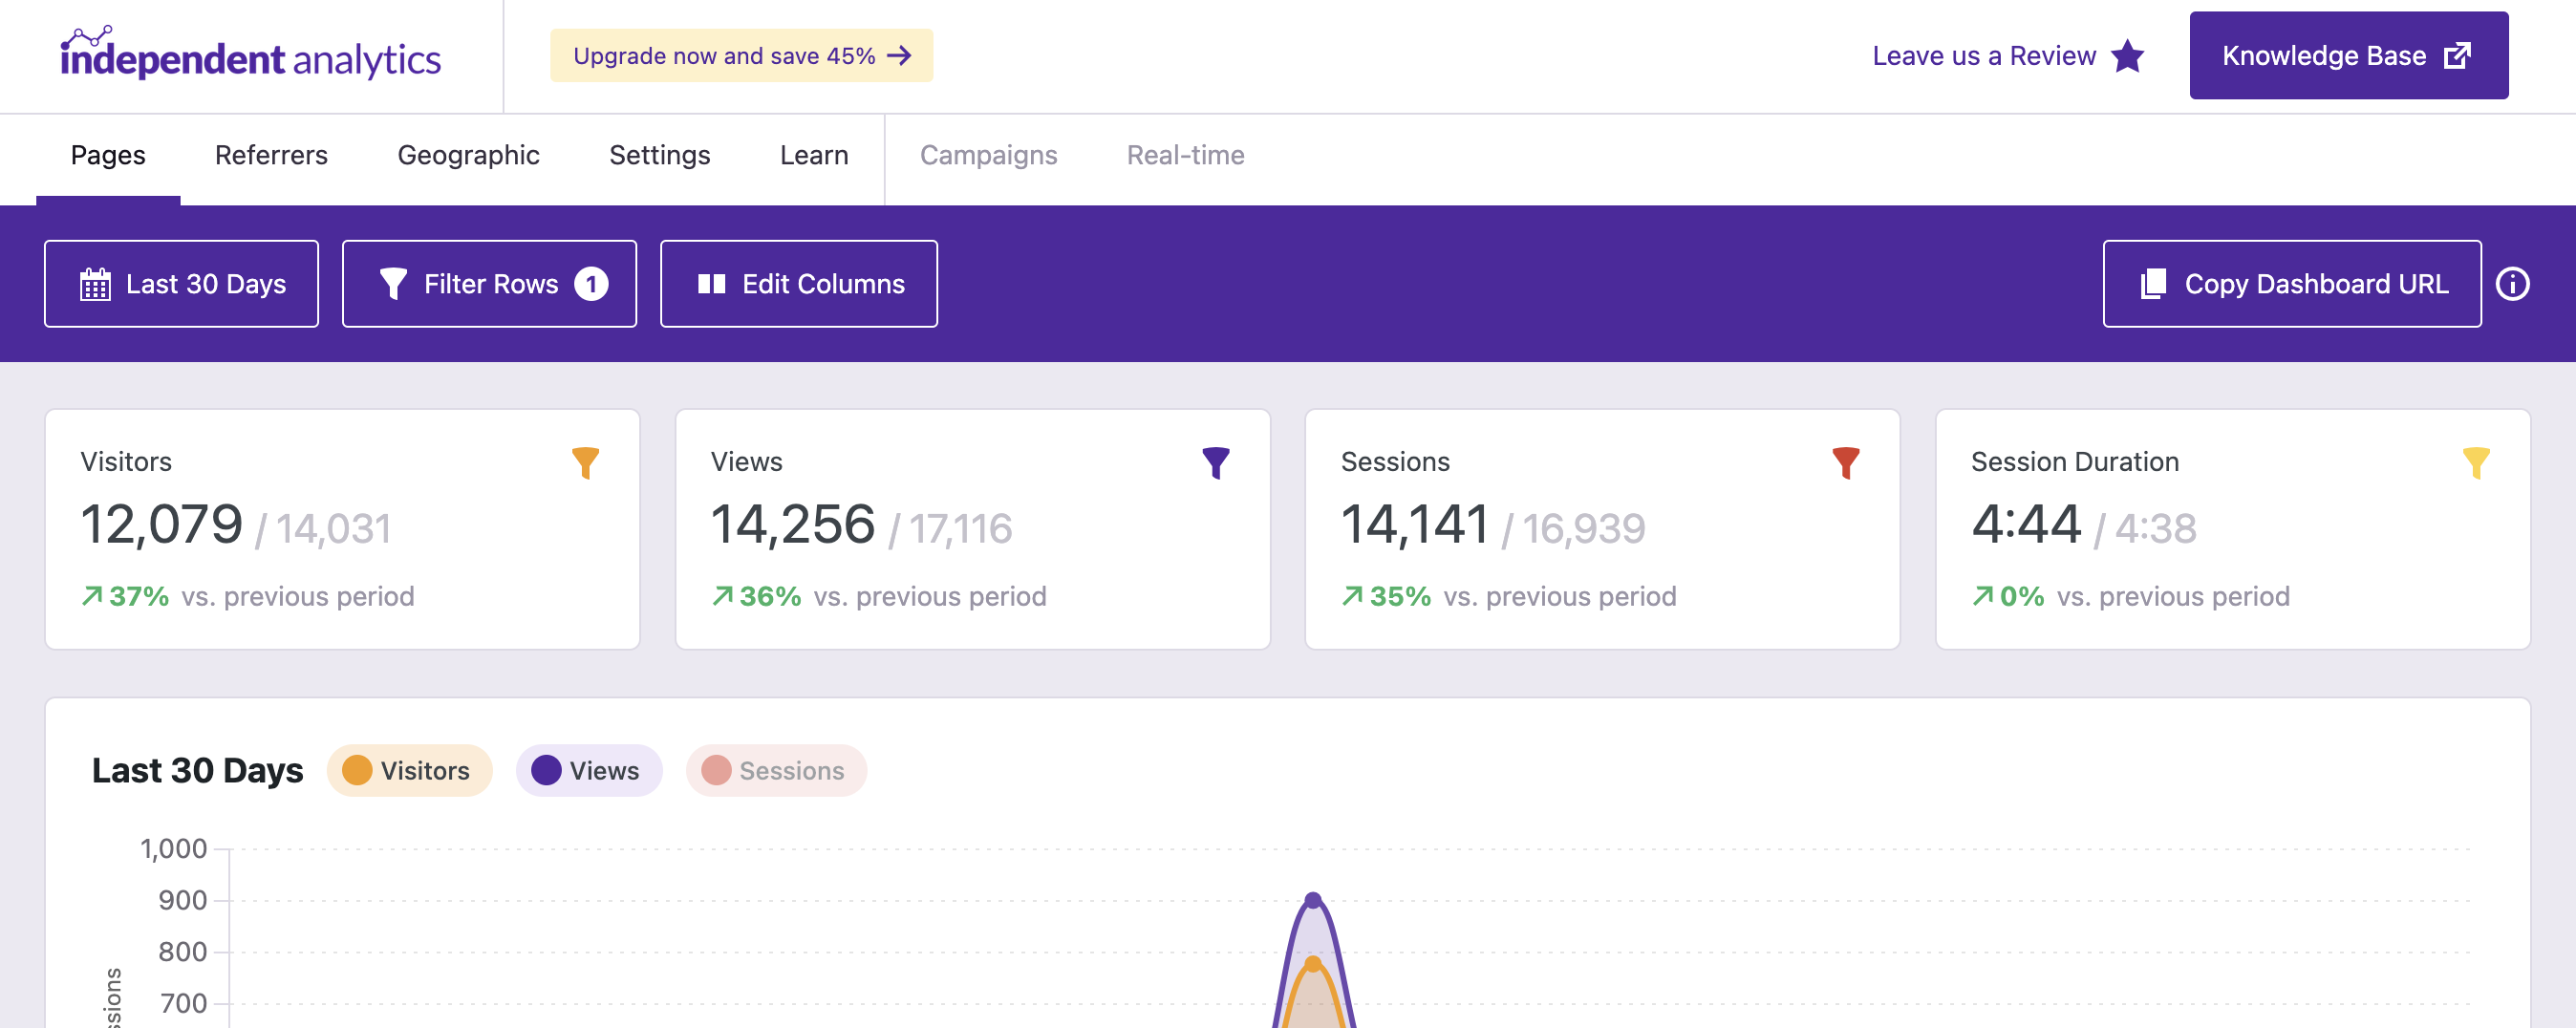
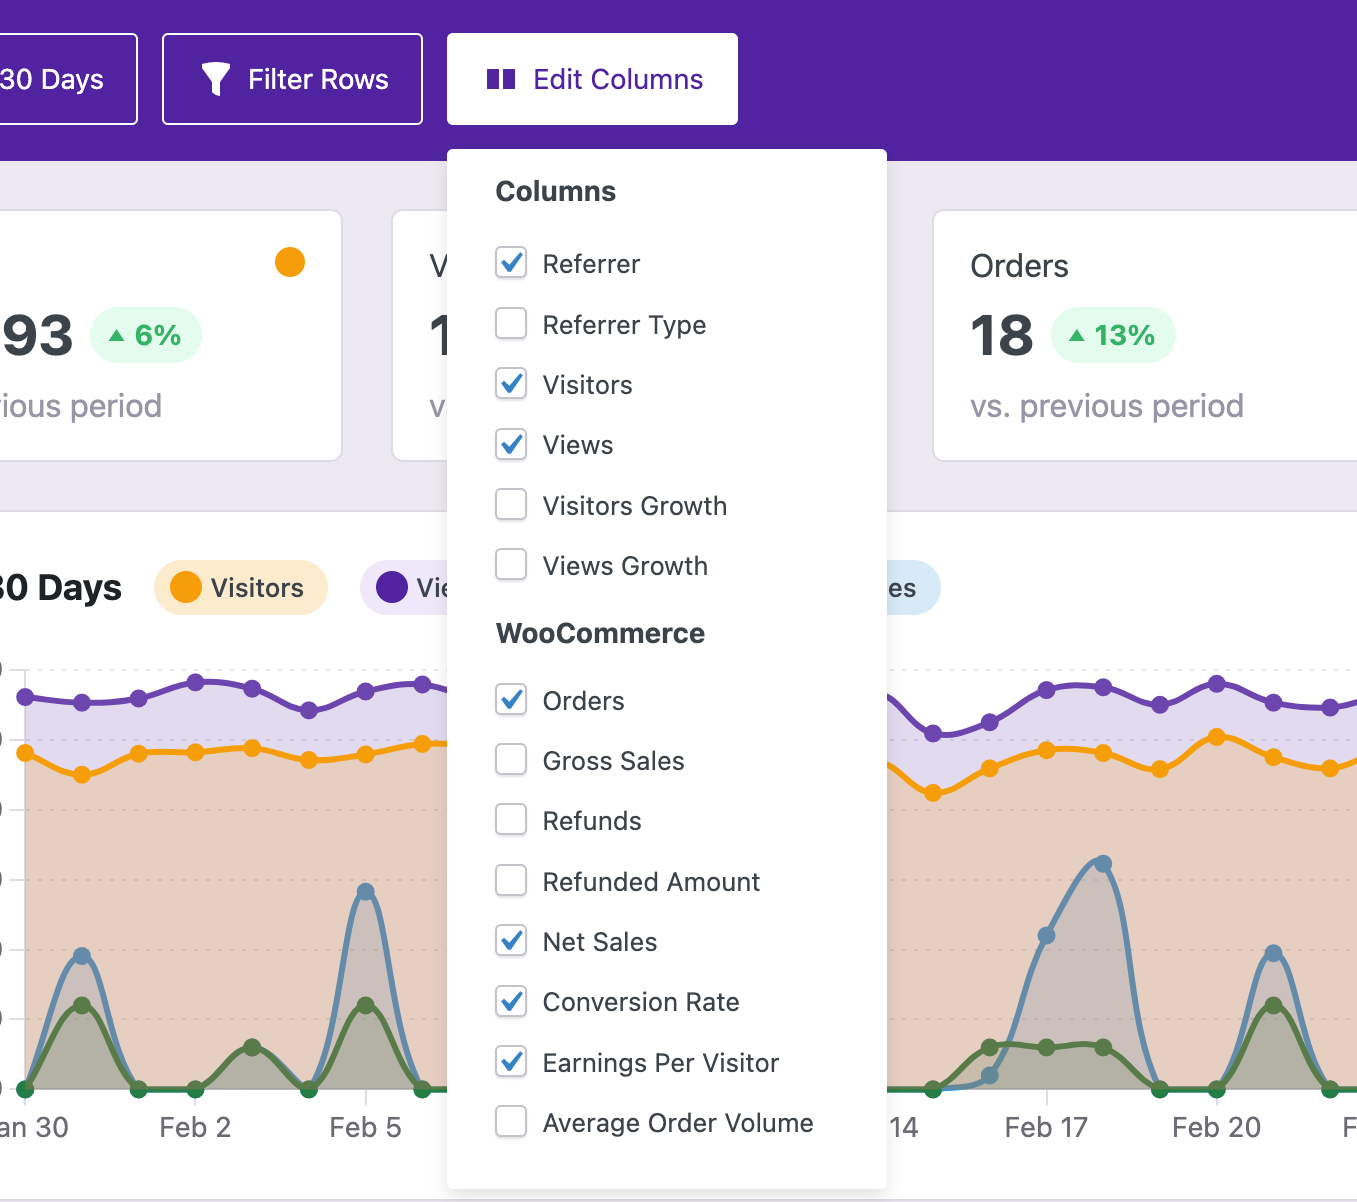
The first thing you'll notice is that the interface has a fresh new look:
While many of the edits were purely cosmetic, there are a few notable changes. First, the Edit Columns button and Grouping button have been moved out of the toolbar and above the data table. Second, you can now plainly read your active filters in the toolbar:
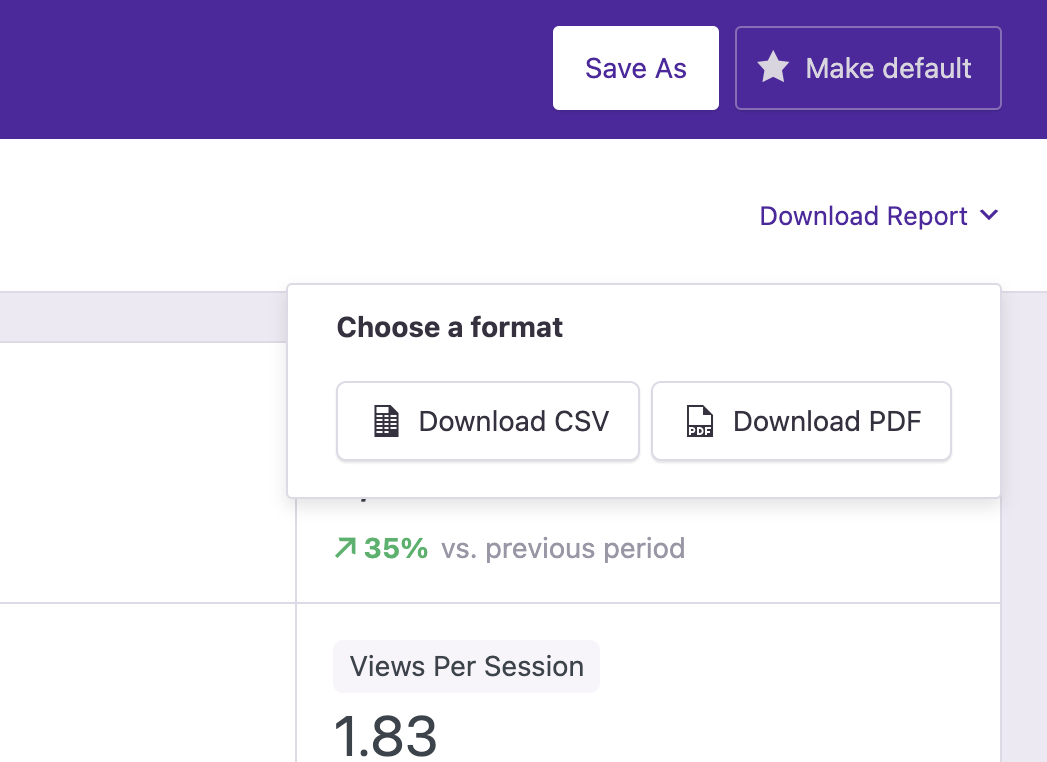
As you can see in the screenshot above, there's now an option to export any report as a PDF. This should prove handy for anyone looking for an easy way to share a report with stakeholders who don't have analytics access.
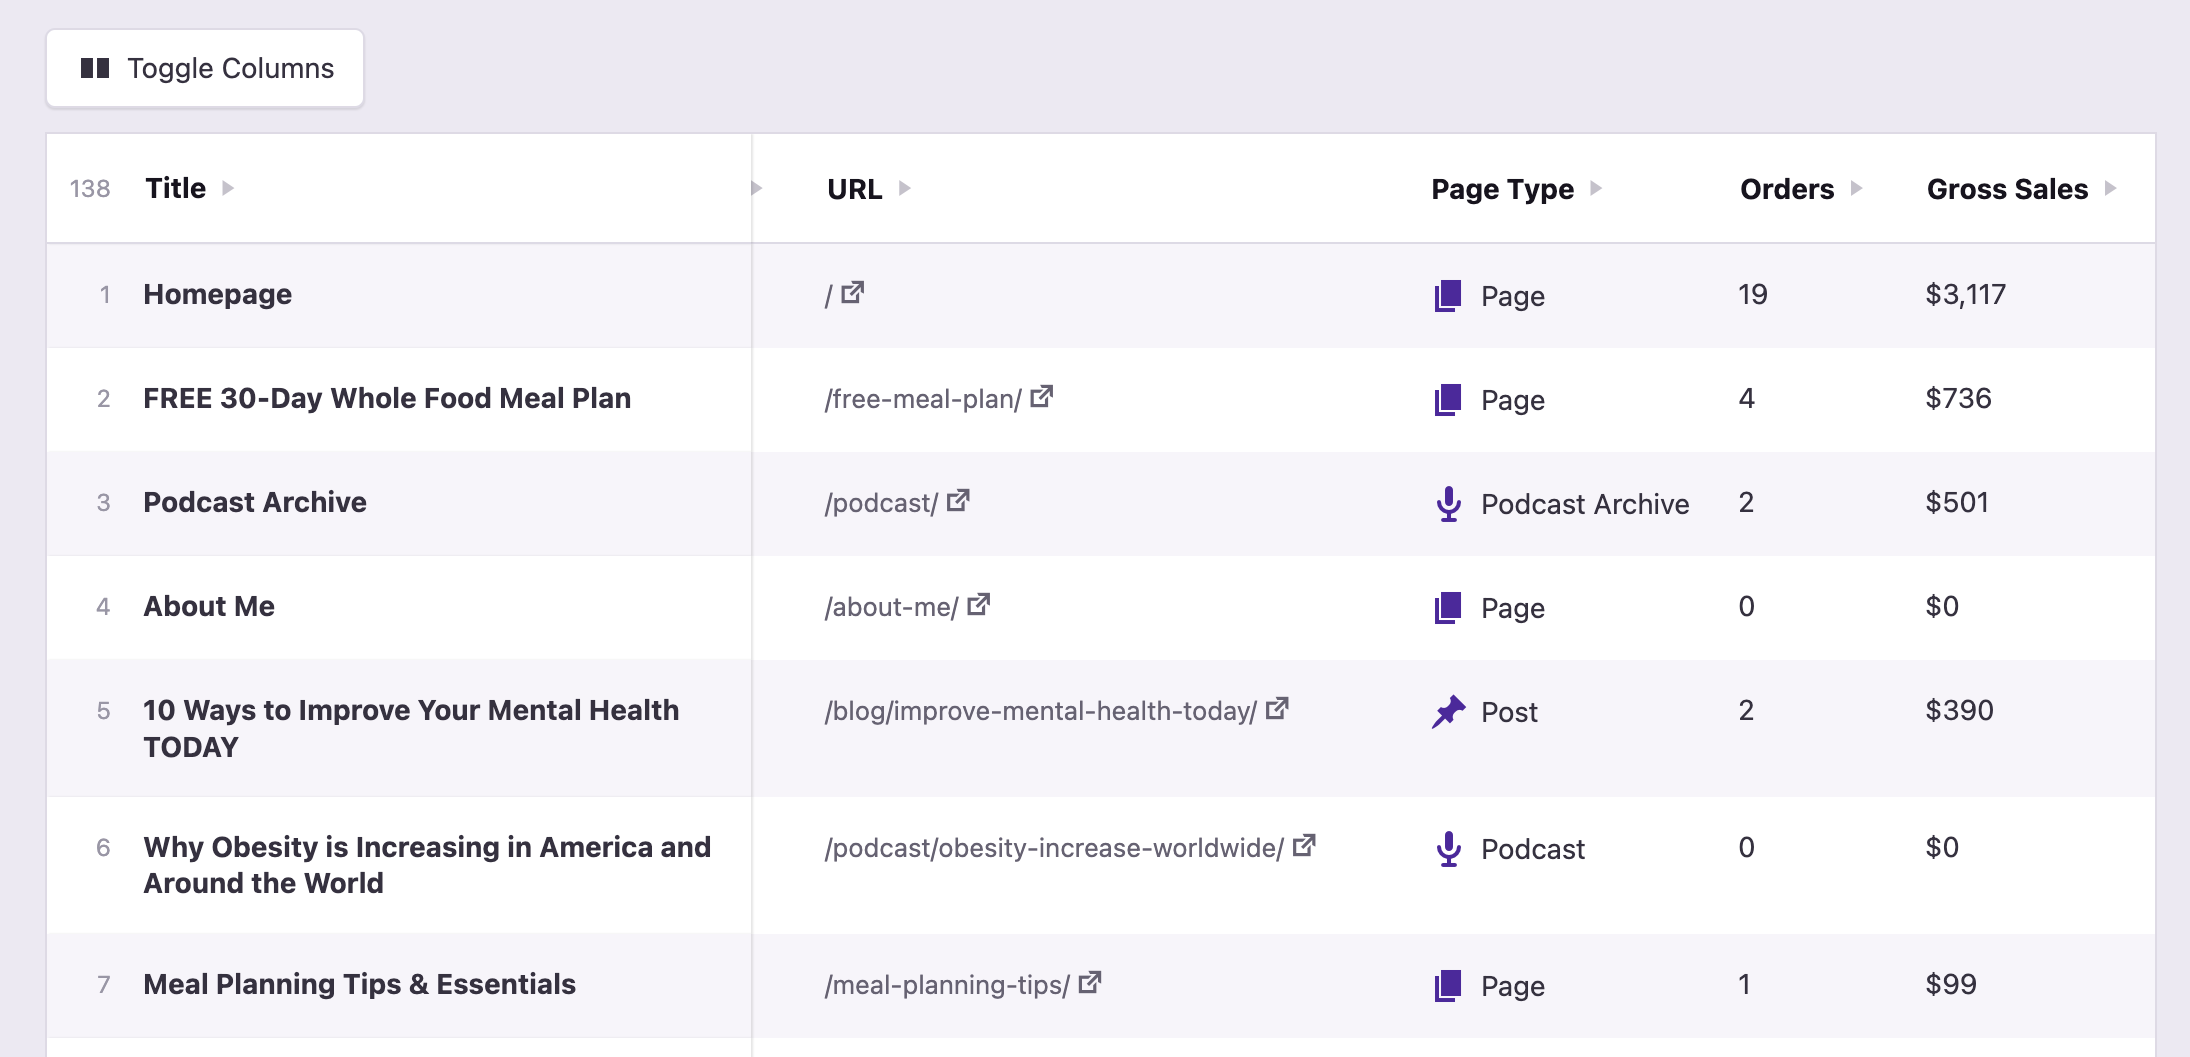
The WooCommerce data columns were omitted from the Pages report up until now because we weren't sure how to handle attribution. After speaking with some of our Pro users, it became clear that the sales should be attributed to the landing page.
Now, when you enable columns like Orders or Net Sales in the Pages menu, you'll be able to see the values referred from each page:
If you see a page with a sale, that means it was the landing page i.e. the first page in the session that led to a sale. This will be particularly useful for any who creates SEO content because you'll be able to see how many sales each article is directly responsible for creating.
Other notable changes
If your website uses an RTL language, you'll be happy to know that we have updated the styles, and the interface is now fully compatible with RTL languages:
Another update that may be important to WC users is that the Checkout Success page is now tracked separately from the Checkout page. For technical reasons, these were viewed as the same page up until now, but moving forward, you'll see the views separate into these two different pages.
Under the Analytics menu item, you'll see that the Settings and Campaign Builder links are now available there. We will be removing these links from the report sidebar in the next update.
What's next?
Version 2.3 is going to include a variety of small enhancements and some additional UI updates. Then, we'll be prepared to add form submission tracking in version 2.4.
We spent most of the past two months working on the performance of the analytics dashboard. The big issue was that the dashboard was taking so long to load that it would crash. This was affecting sites with hundreds of thousands or millions of visitors per month.
We had to rewrite a lot of the back-end structure and queries, but the dashboard no longer crashes, even if the site gets millions of visitors every month. The dashboard also loads a couple of seconds faster for all users. The changes we've made in this release will also make it easier for us to improve performance further in the future.
We also made an optimization to the front-end. While the REST API request is asynchronous and doesn't affect UX or SEO, it was worrisome how long it took to load on some websites. This mainly affected sites with a large number of plugins installed. With our new optimizations, the REST API request completes in about 100-200ms regardless of how many plugins are installed.
WooCommerce Order Referrers
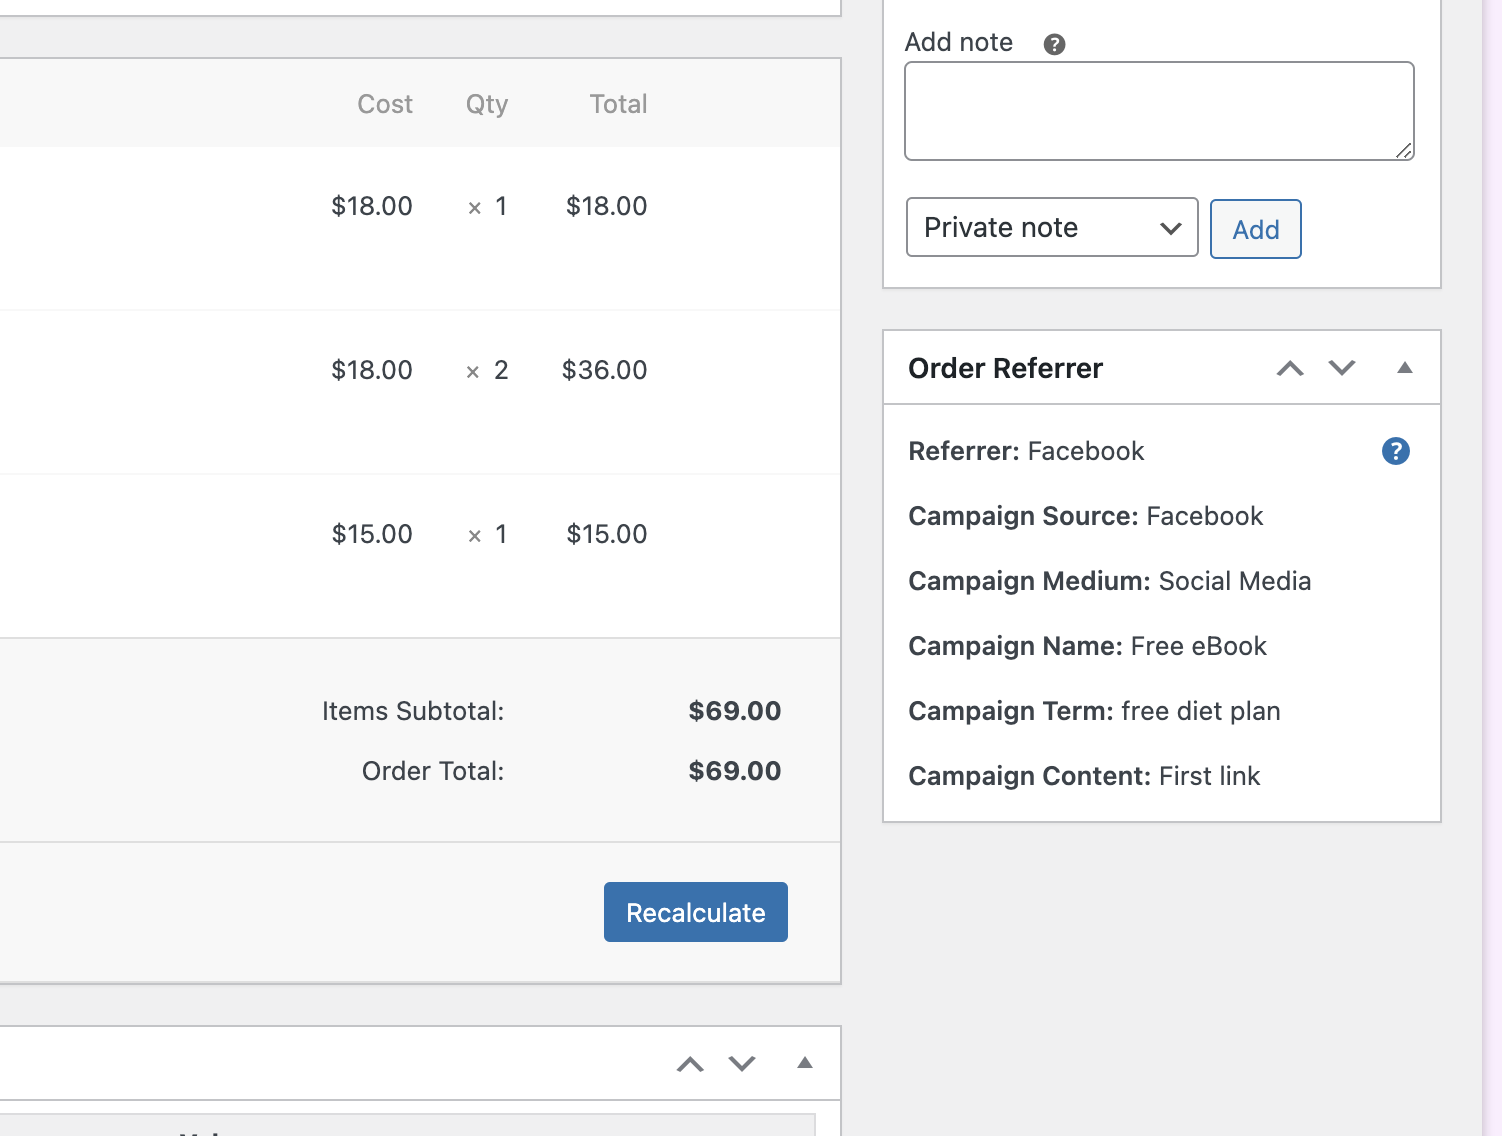
For our Pro users, we added a new Order Referrers box to the WooCommerce Order page.
This will tell you the source of the sale, and if a Campaign URL was used, you'll also see the campaign parameters listed.
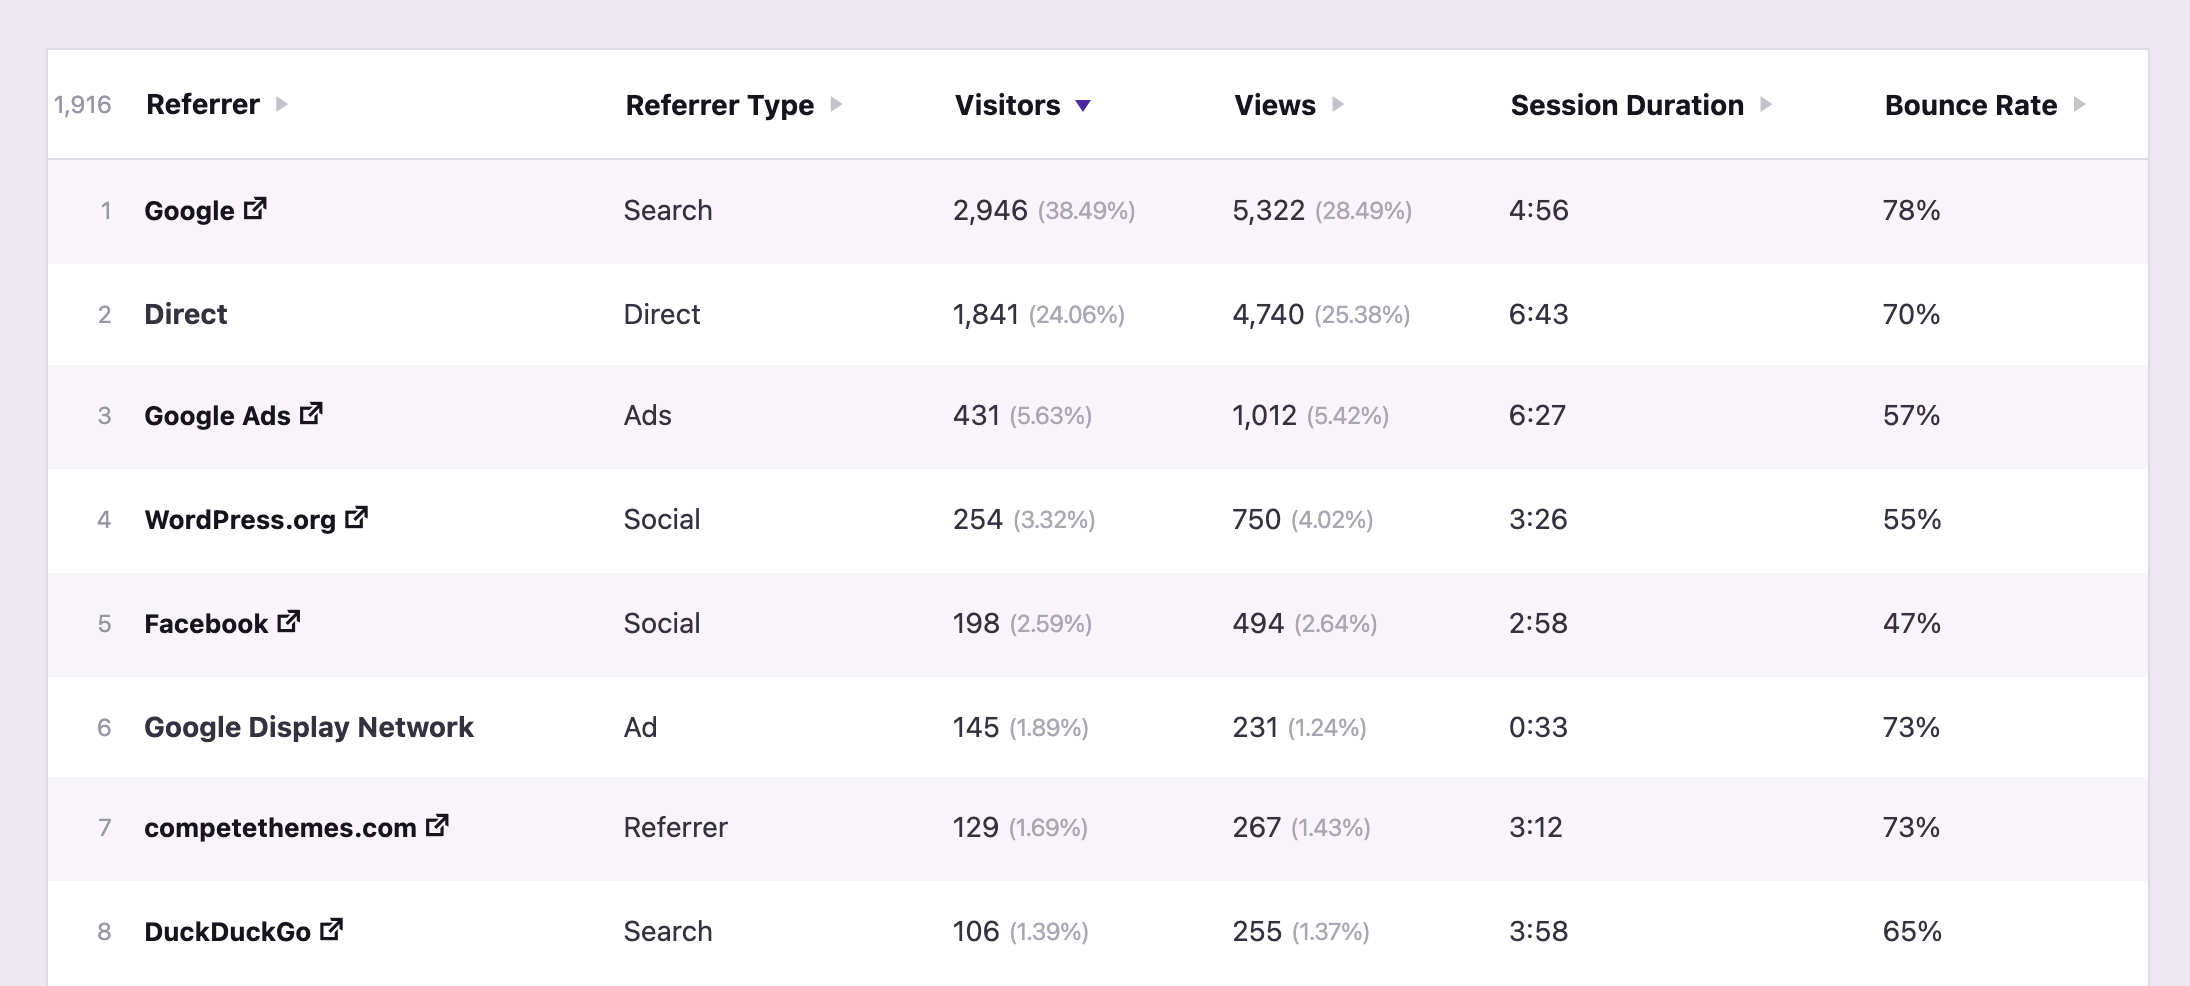
Google Ads separated from Google organic traffic
Since traffic from Google Ads comes from google.com, it's always been reported as "Google" in the Referrers report. This has made it impossible to differentiate between paid traffic and organic traffic. Now, any visitors that come from paid ads will be attributed to "Google Ads," while organic traffic will remain attributed to "Google."
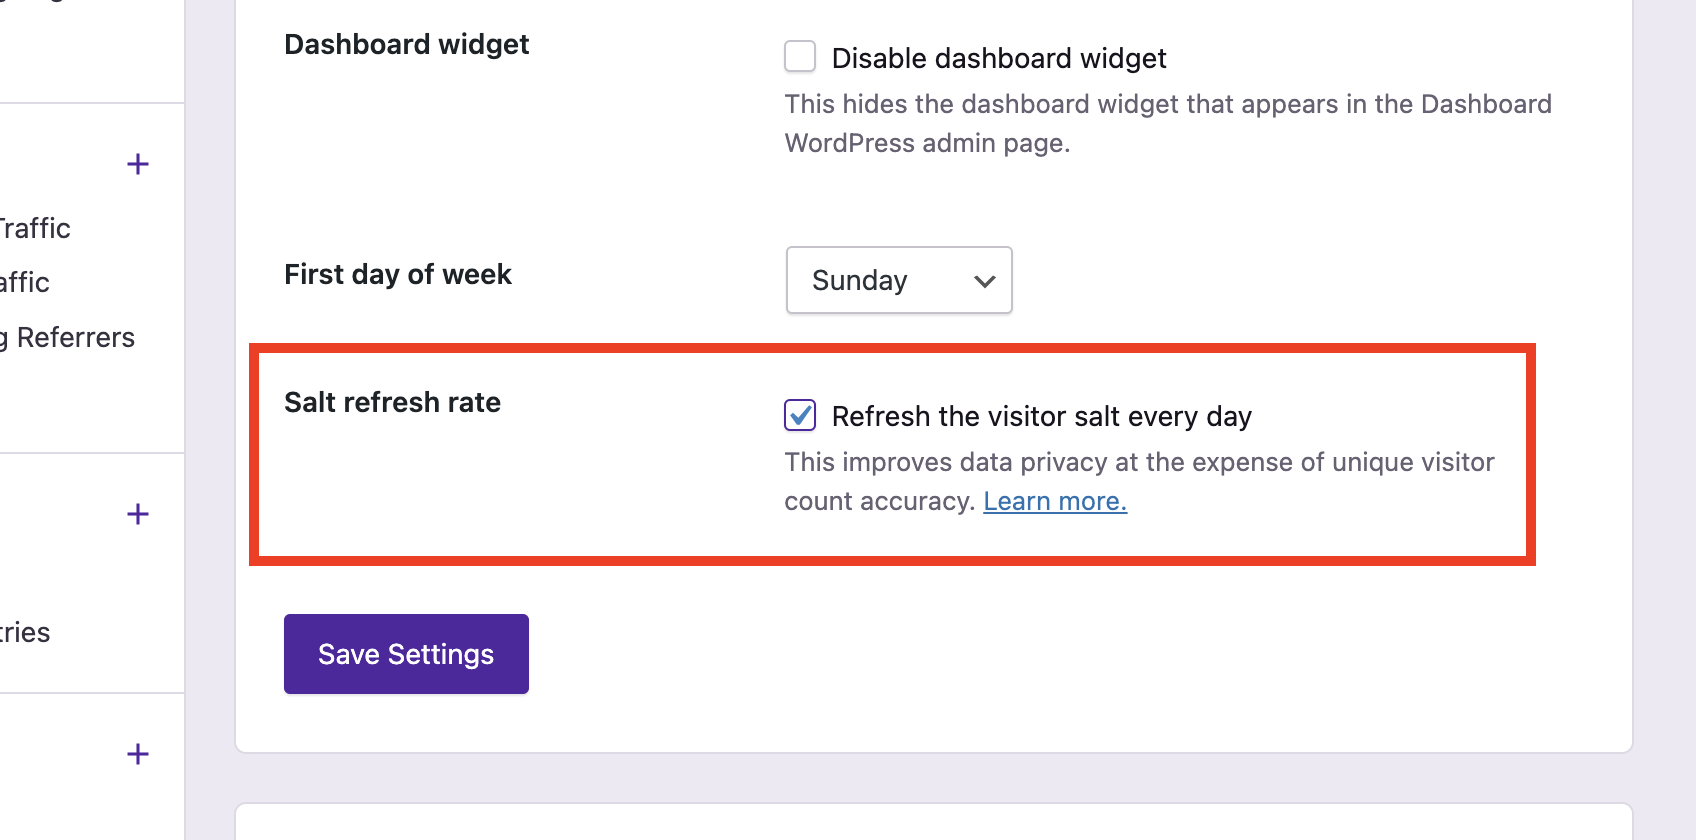
This ensures that the encrypted IP addresses are hashed using a new salt every day, which limits the exposure of personal data in the event of successful decrypting. This comes at the expense of less accurate visitor counts.
We launched the first iteration of our developer API, which includes two functions. One function gets the views, visitors, and sessions from a given date range. The other function returns the same data but for a specific page/post.
Lastly, we thought it would be cool to show a notification in the sidebar each time the plugin is updated. This will give you an easy way to access info about the latest updates so you can keep up with the latest changes.
What's next?
In the next update, we want to get back to our old habit of lighter, faster releases. Our goal is to implement a handful of small features, such as:
WooCommerce data columns in the Pages menu
UI improvements
We'll then be prepared to tackle larger features again, such as form submission tracking, which we are eager to implement.
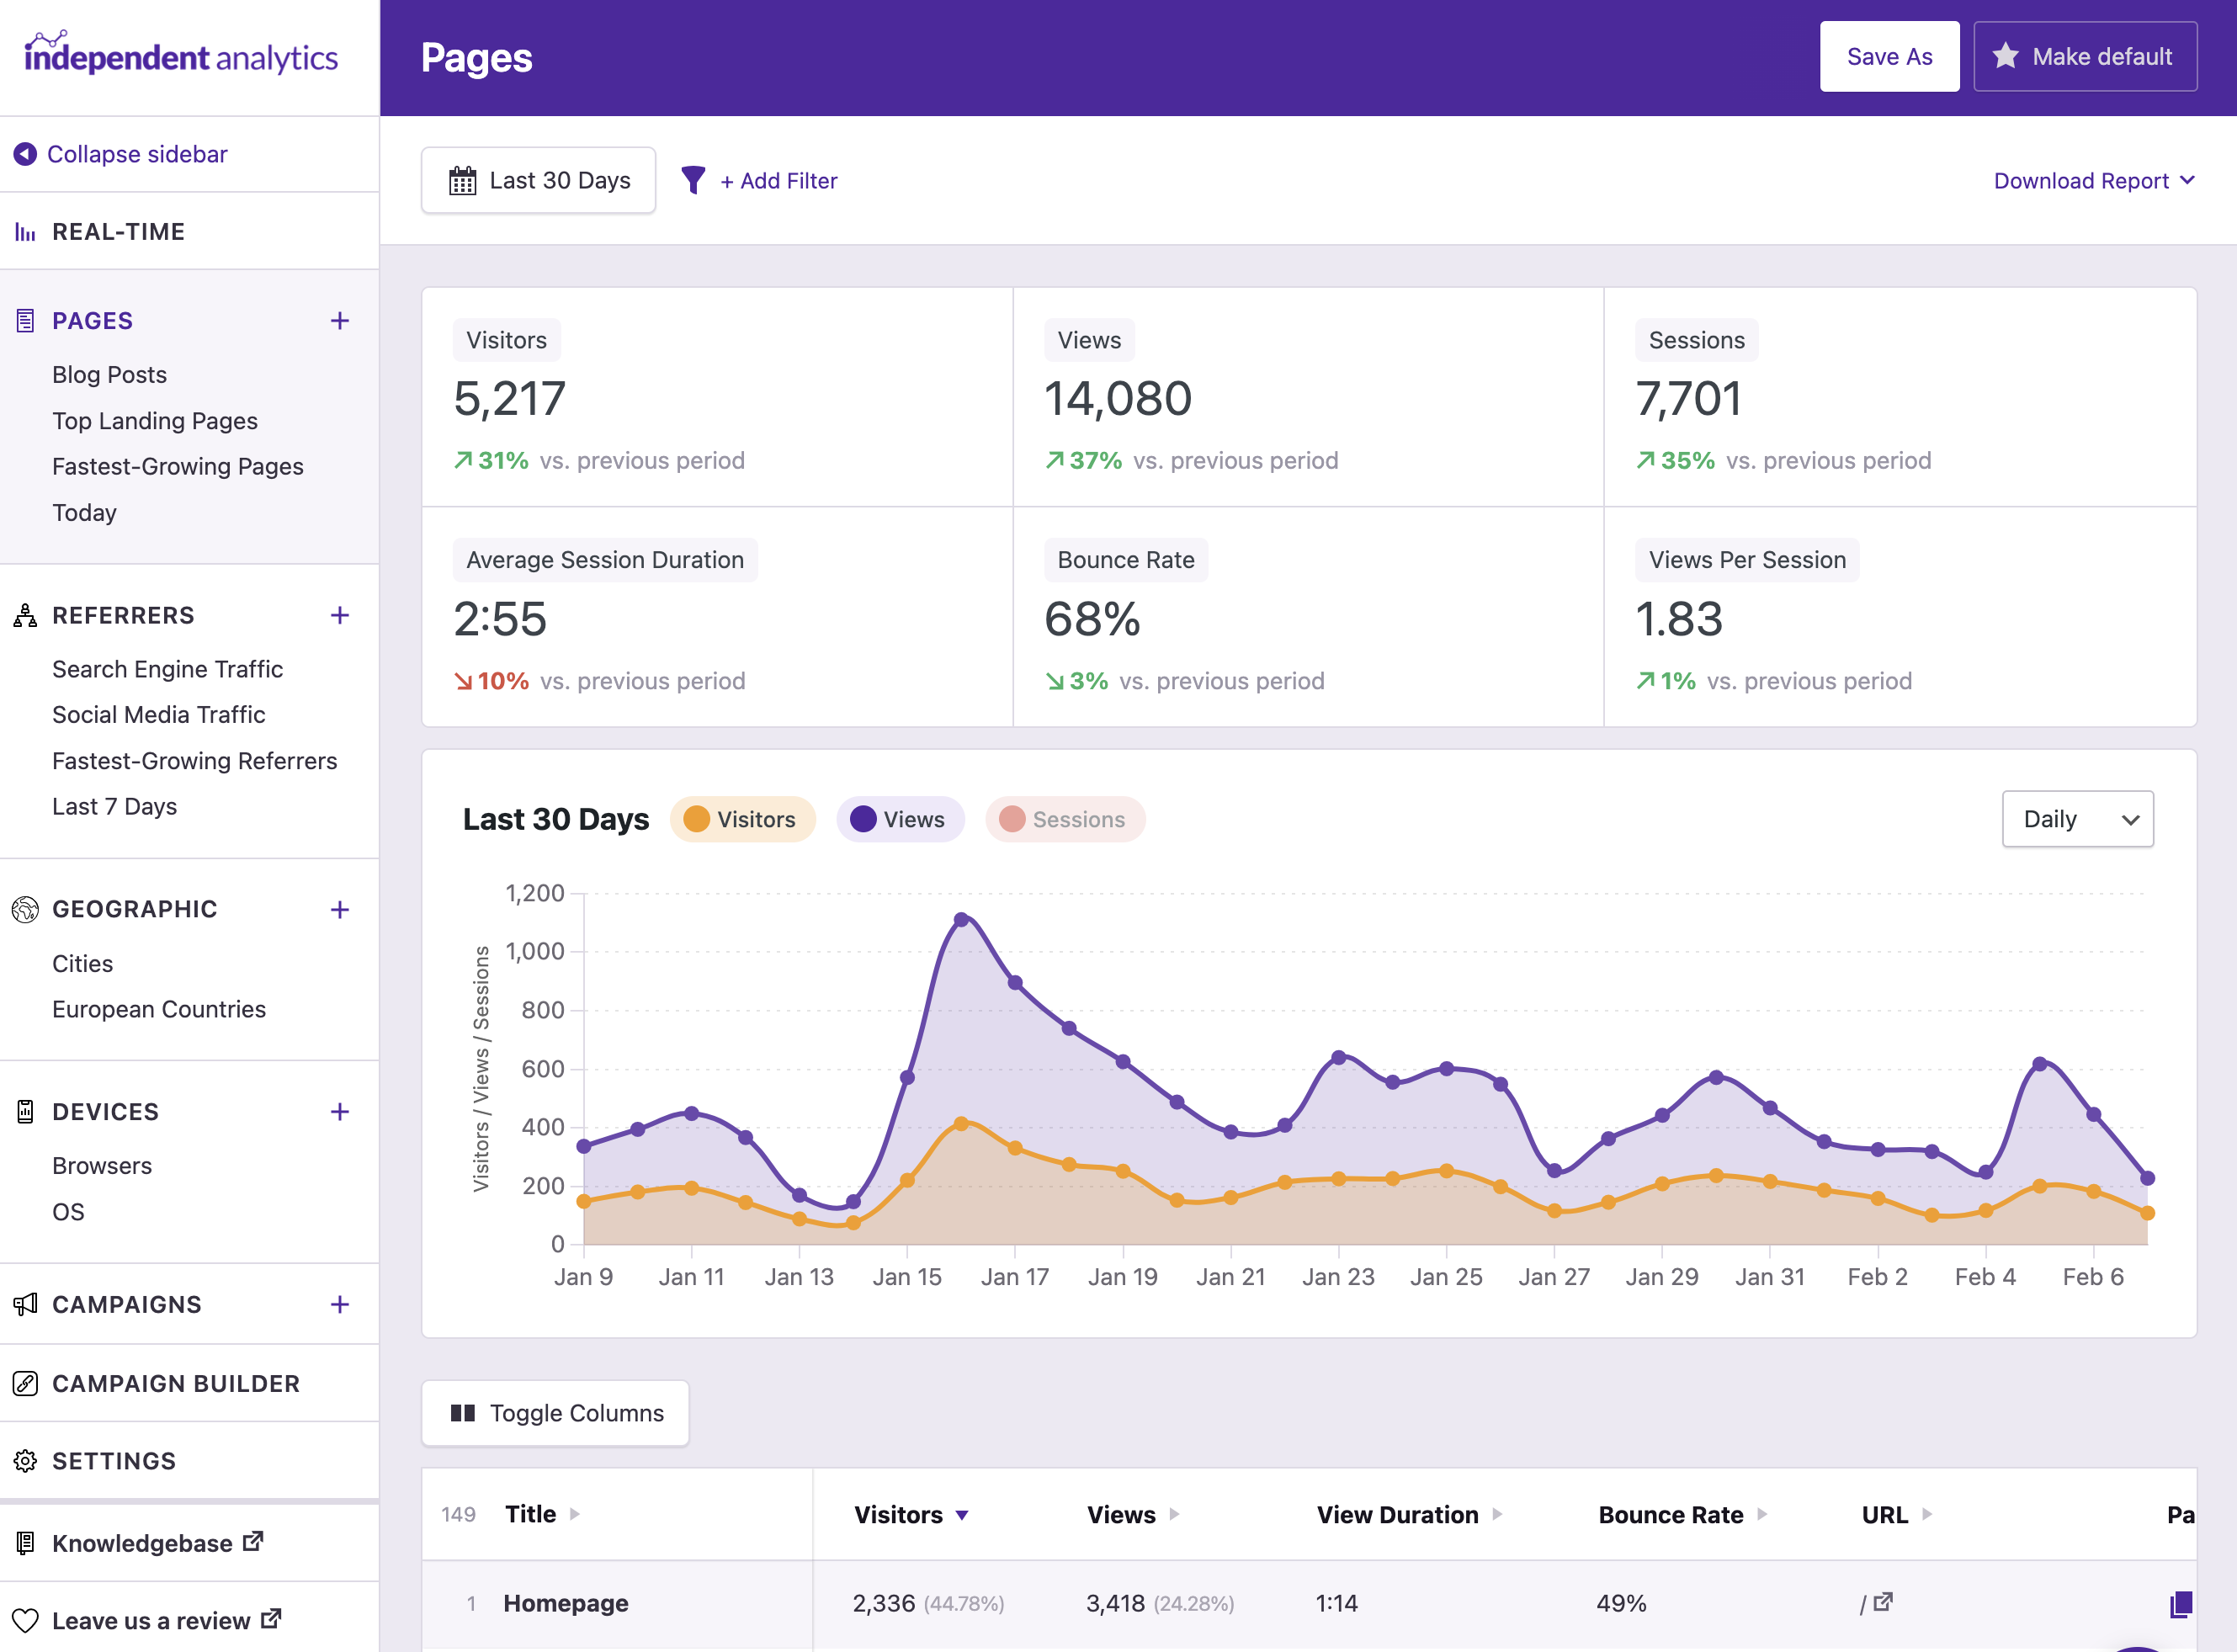
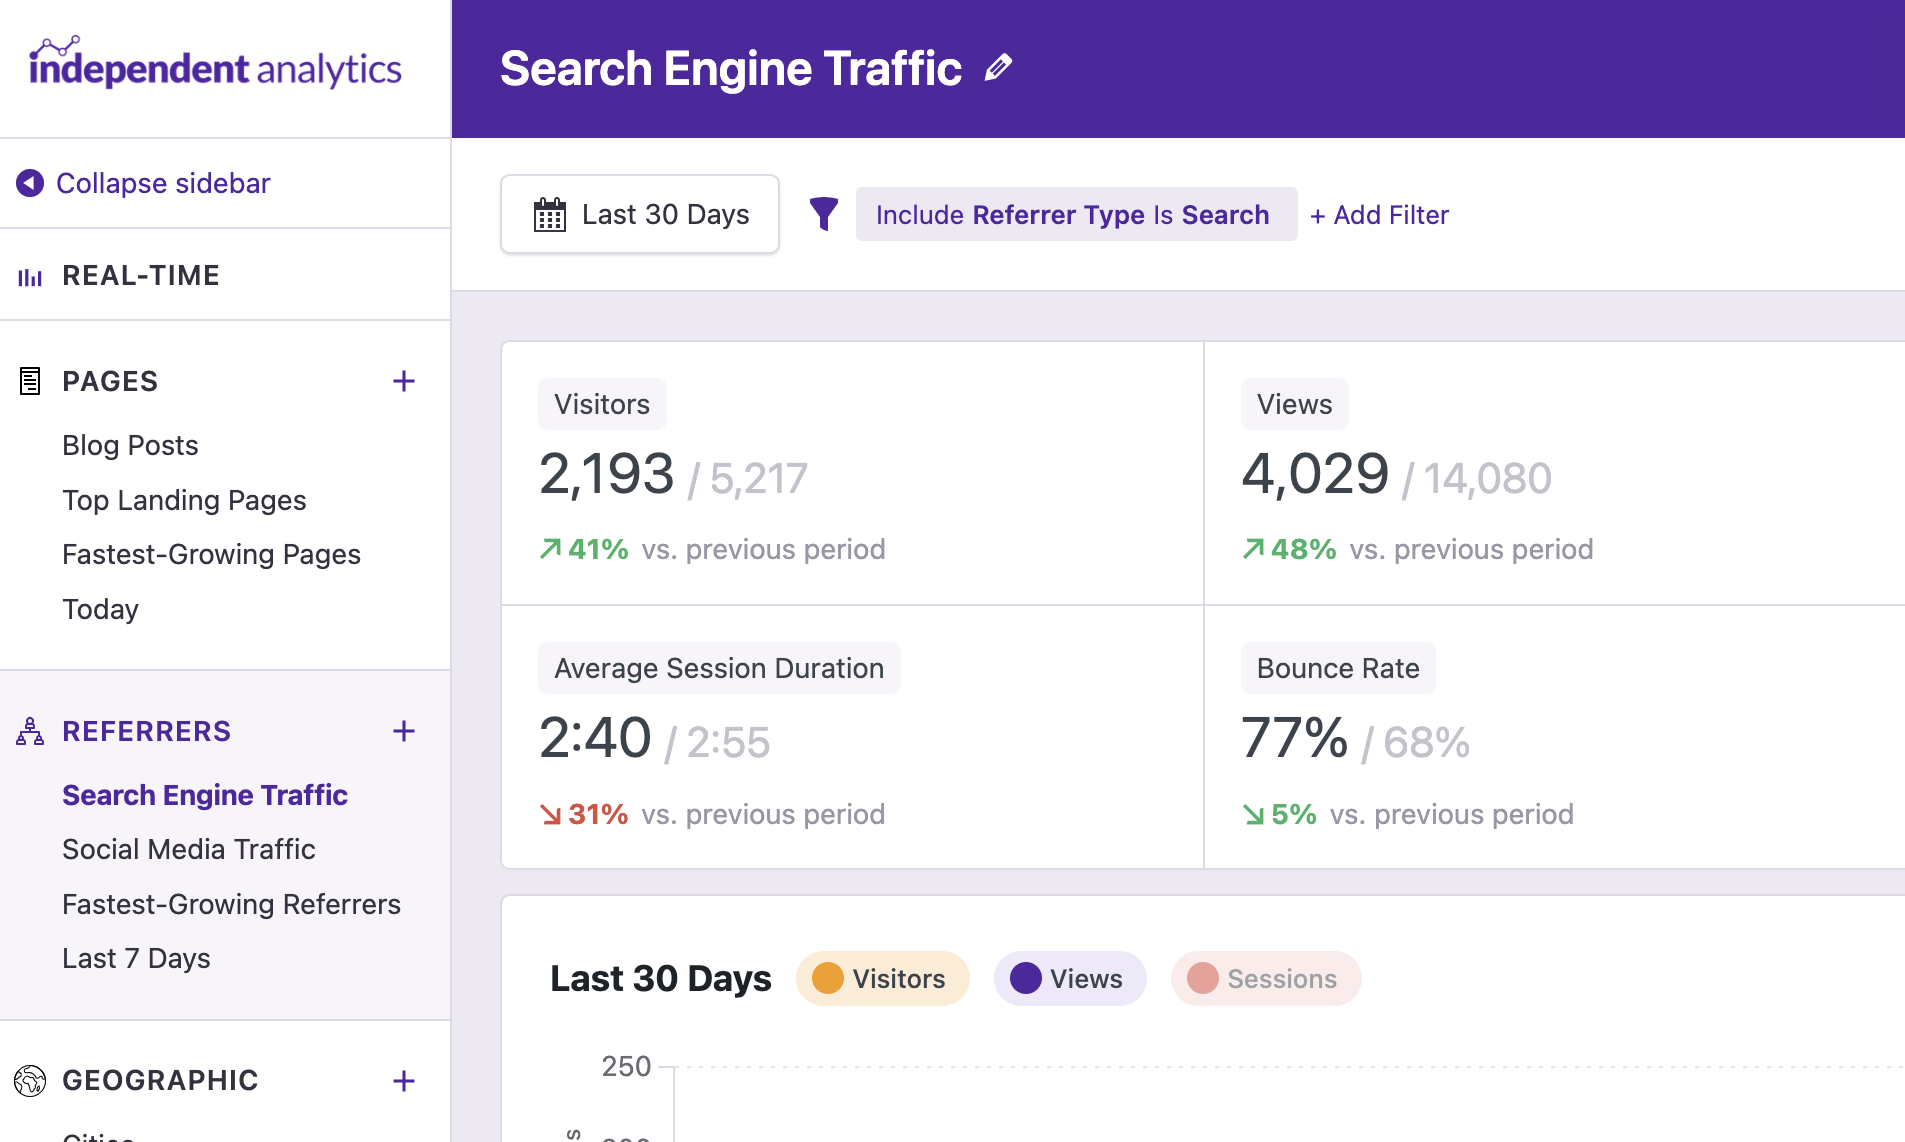
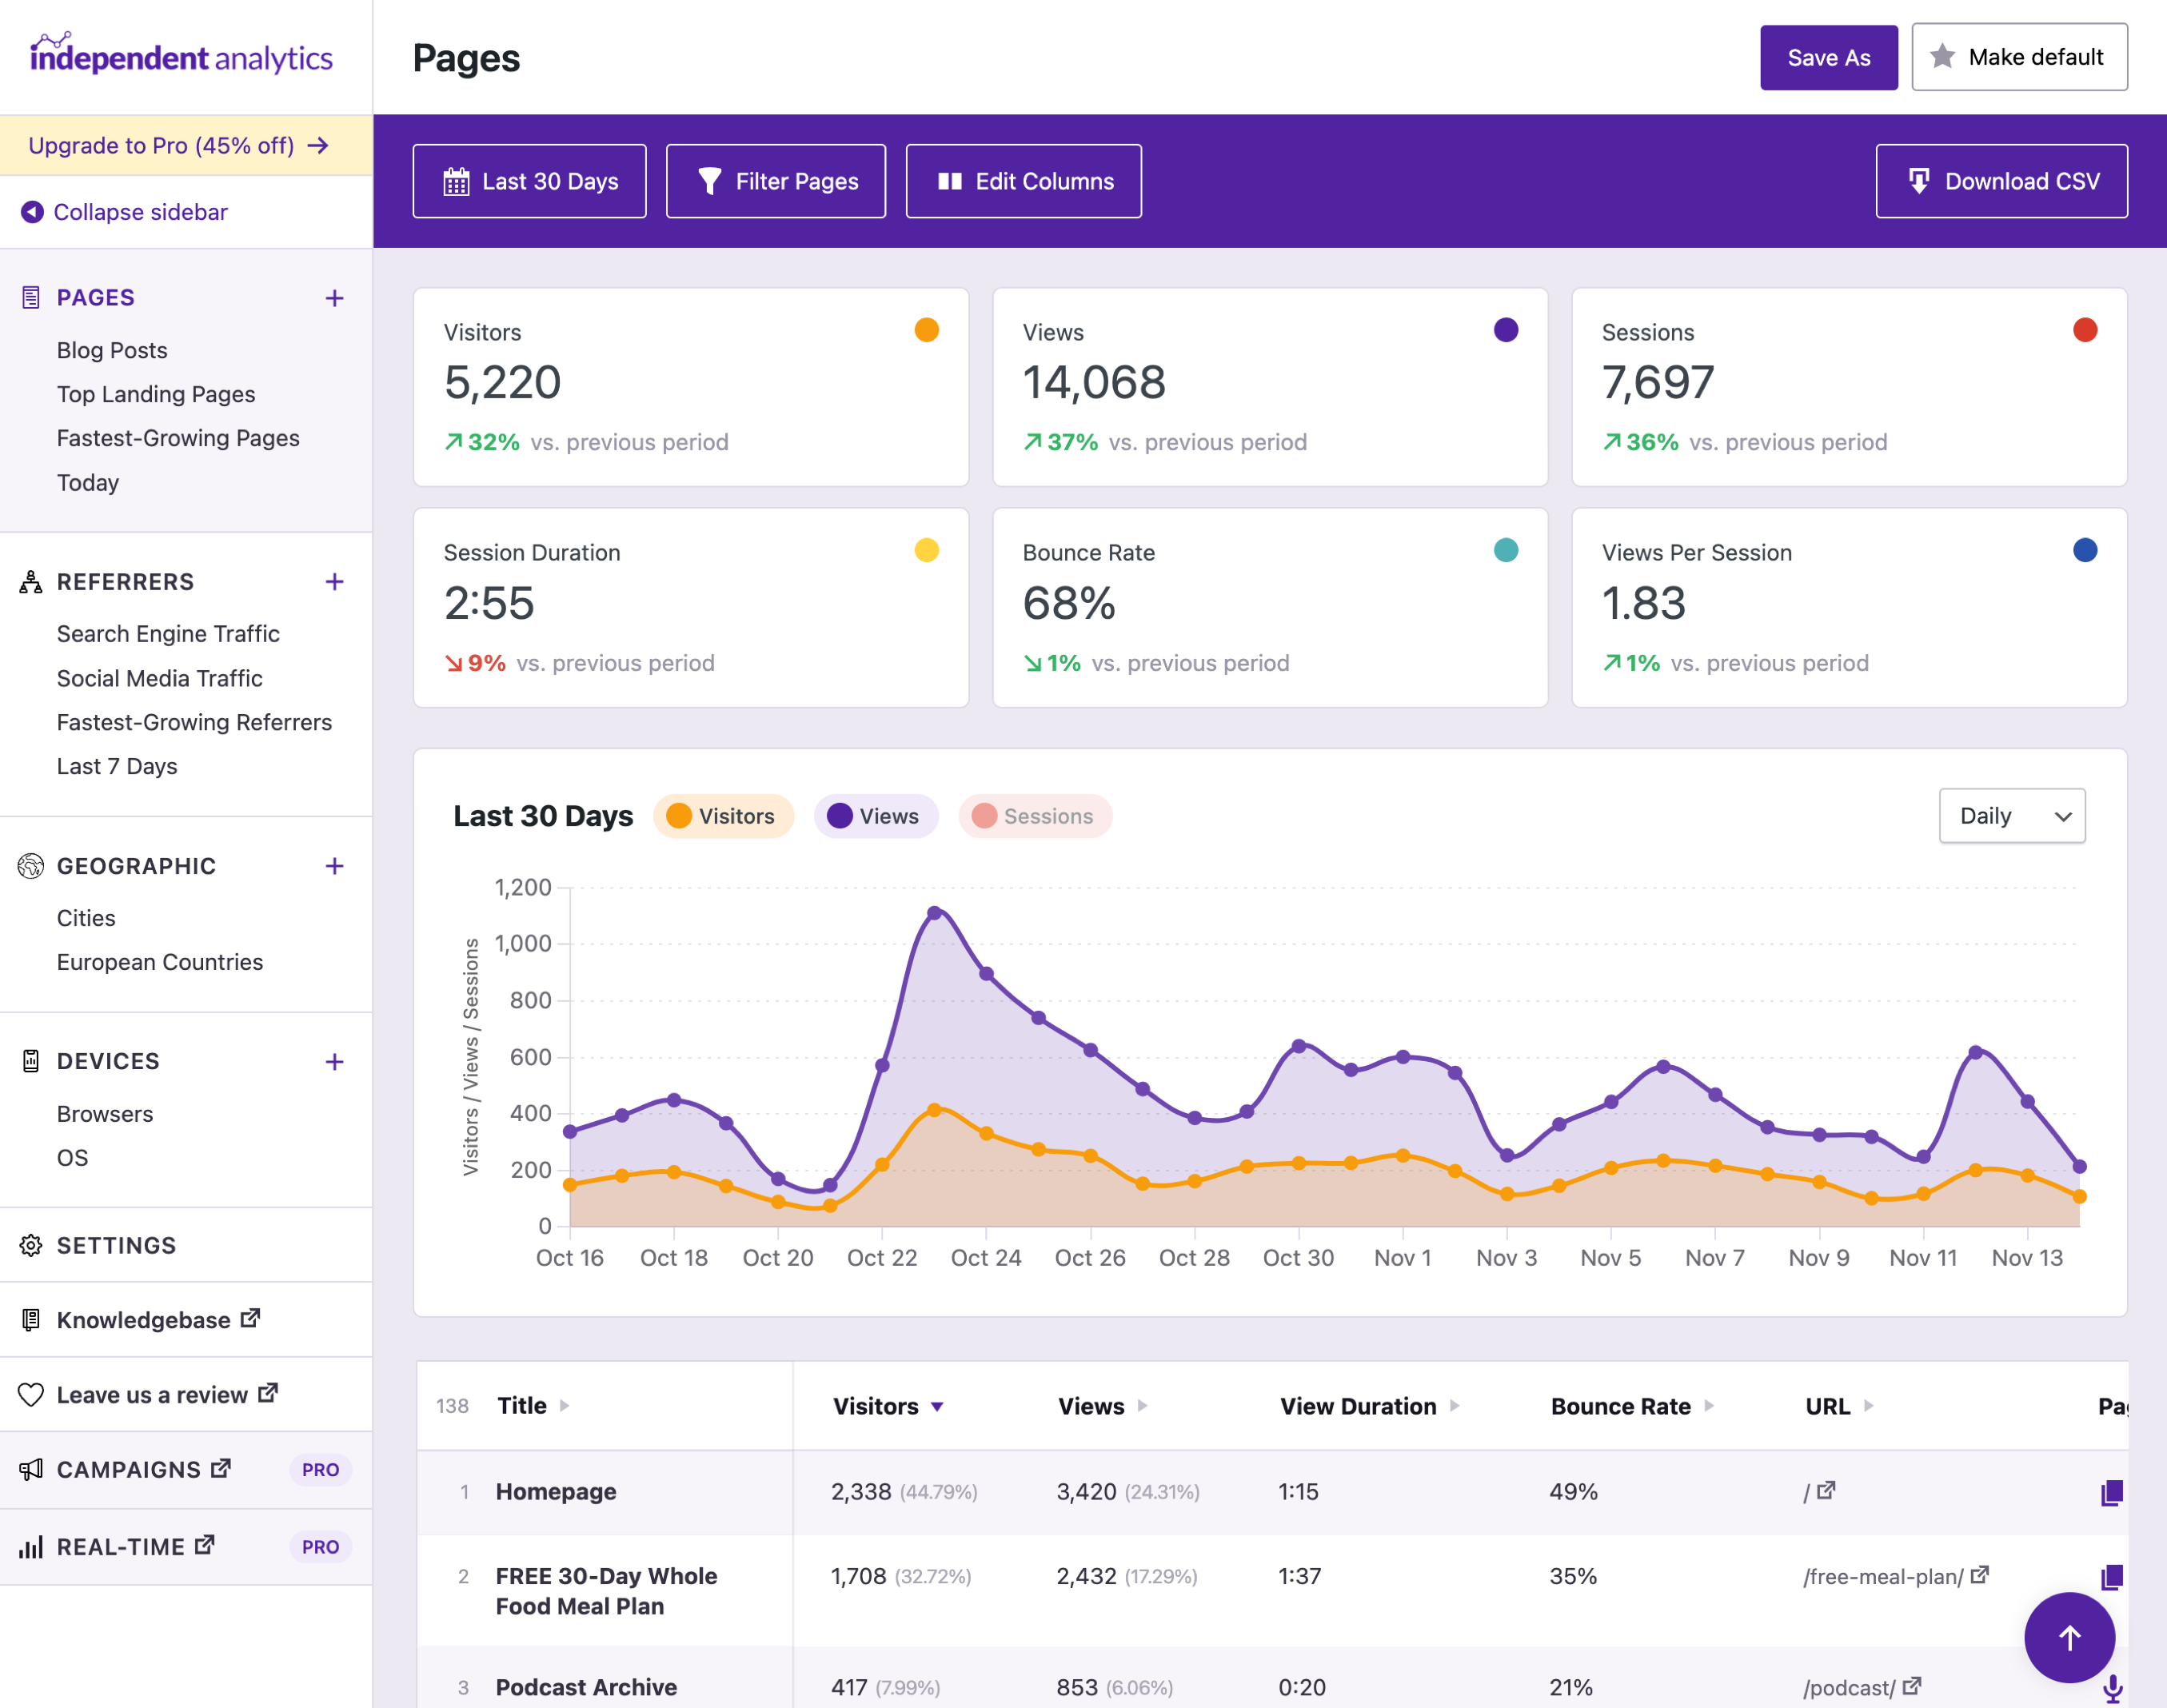
In the sidebar, you'll find the same familiar reports (Pages, Referrers, etc.), but you'll also find new sub-reports under each one. For instance, you can see a Search Engine Traffic report under Referrers.
These sub-reports use tools in IA like filters and sorting to present unique data. For example, the Social Media Traffic report has been filtered to only include traffic from social media sites.
These additional reports are practical on their own, but we haven't gotten to the good part yet.
The sub-reports are entirely custom. You can rename/edit/delete them and add as many new custom reports as you'd like.
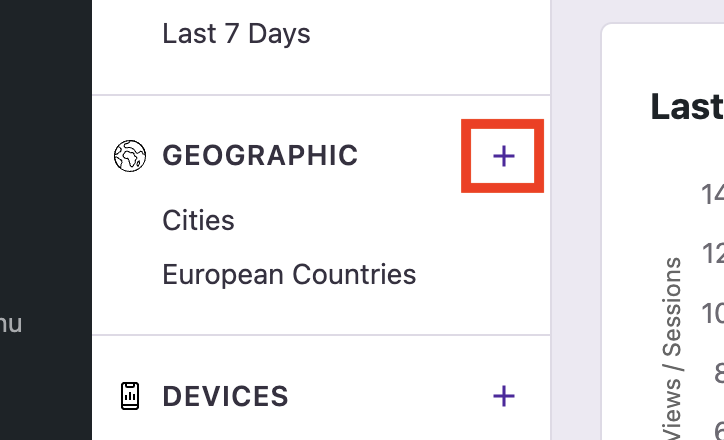
You can create a new report by clicking one of the plus buttons in the sidebar.
Then, you can give it a new title and customize the report to your liking. The report can save every change you make, including edits to the:
Date range
Filters
Column visibility
Sorting
Grouping
Chart metrics
Chart interval (hourly, daily, etc.)
This allows you to create entirely custom reports and fill out the sidebar with the data that is most important for your business.
You can also use the Save As button to spin off new reports while making changes and click the "Make default" button to set any report as the default to view whenever you visit the Analytics menu.
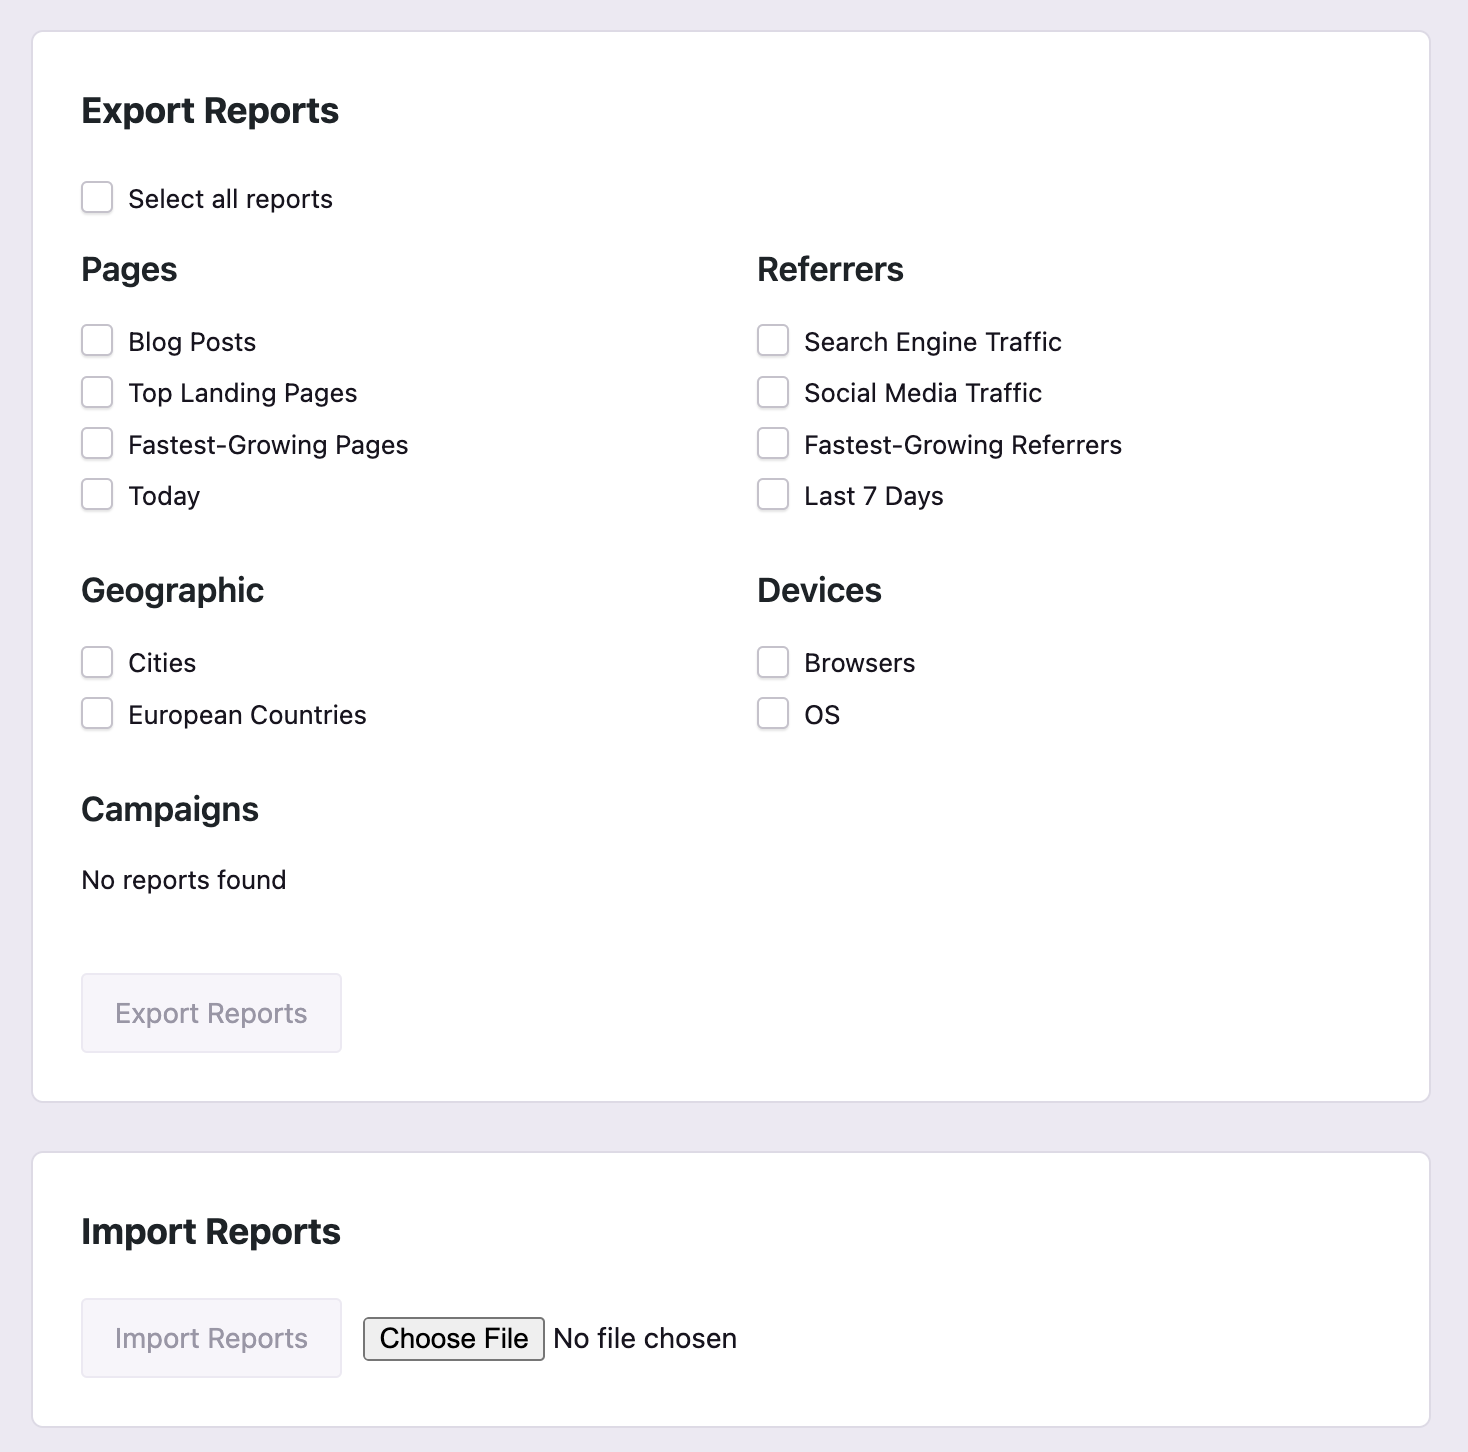
Export & Import Reports
If you have multiple sites with similar business goals, it'd be a pain to recreate the same reports repeatedly. That's why we've included the ability to export and import reports in the Settings menu.
Using this feature, you can create an entire suite of custom reports and then quickly export and import them into any other site you want.
What's next?
We are really proud of this update, and we're excited to see what kind of reports everyone creates.
We want everyone to be able to take advantage of the awesome new UI, and that's why we're focusing on major performance enhancements next. It's come to our attention that the dashboard loads very slowly for sites with 100K or more visitors per month, and we'd like to change that.
The next update should create a massive difference in load times, and while this will be more evident on high-traffic websites, sites with low to moderate traffic should also notice a nice improvement in how quickly the analytics load.
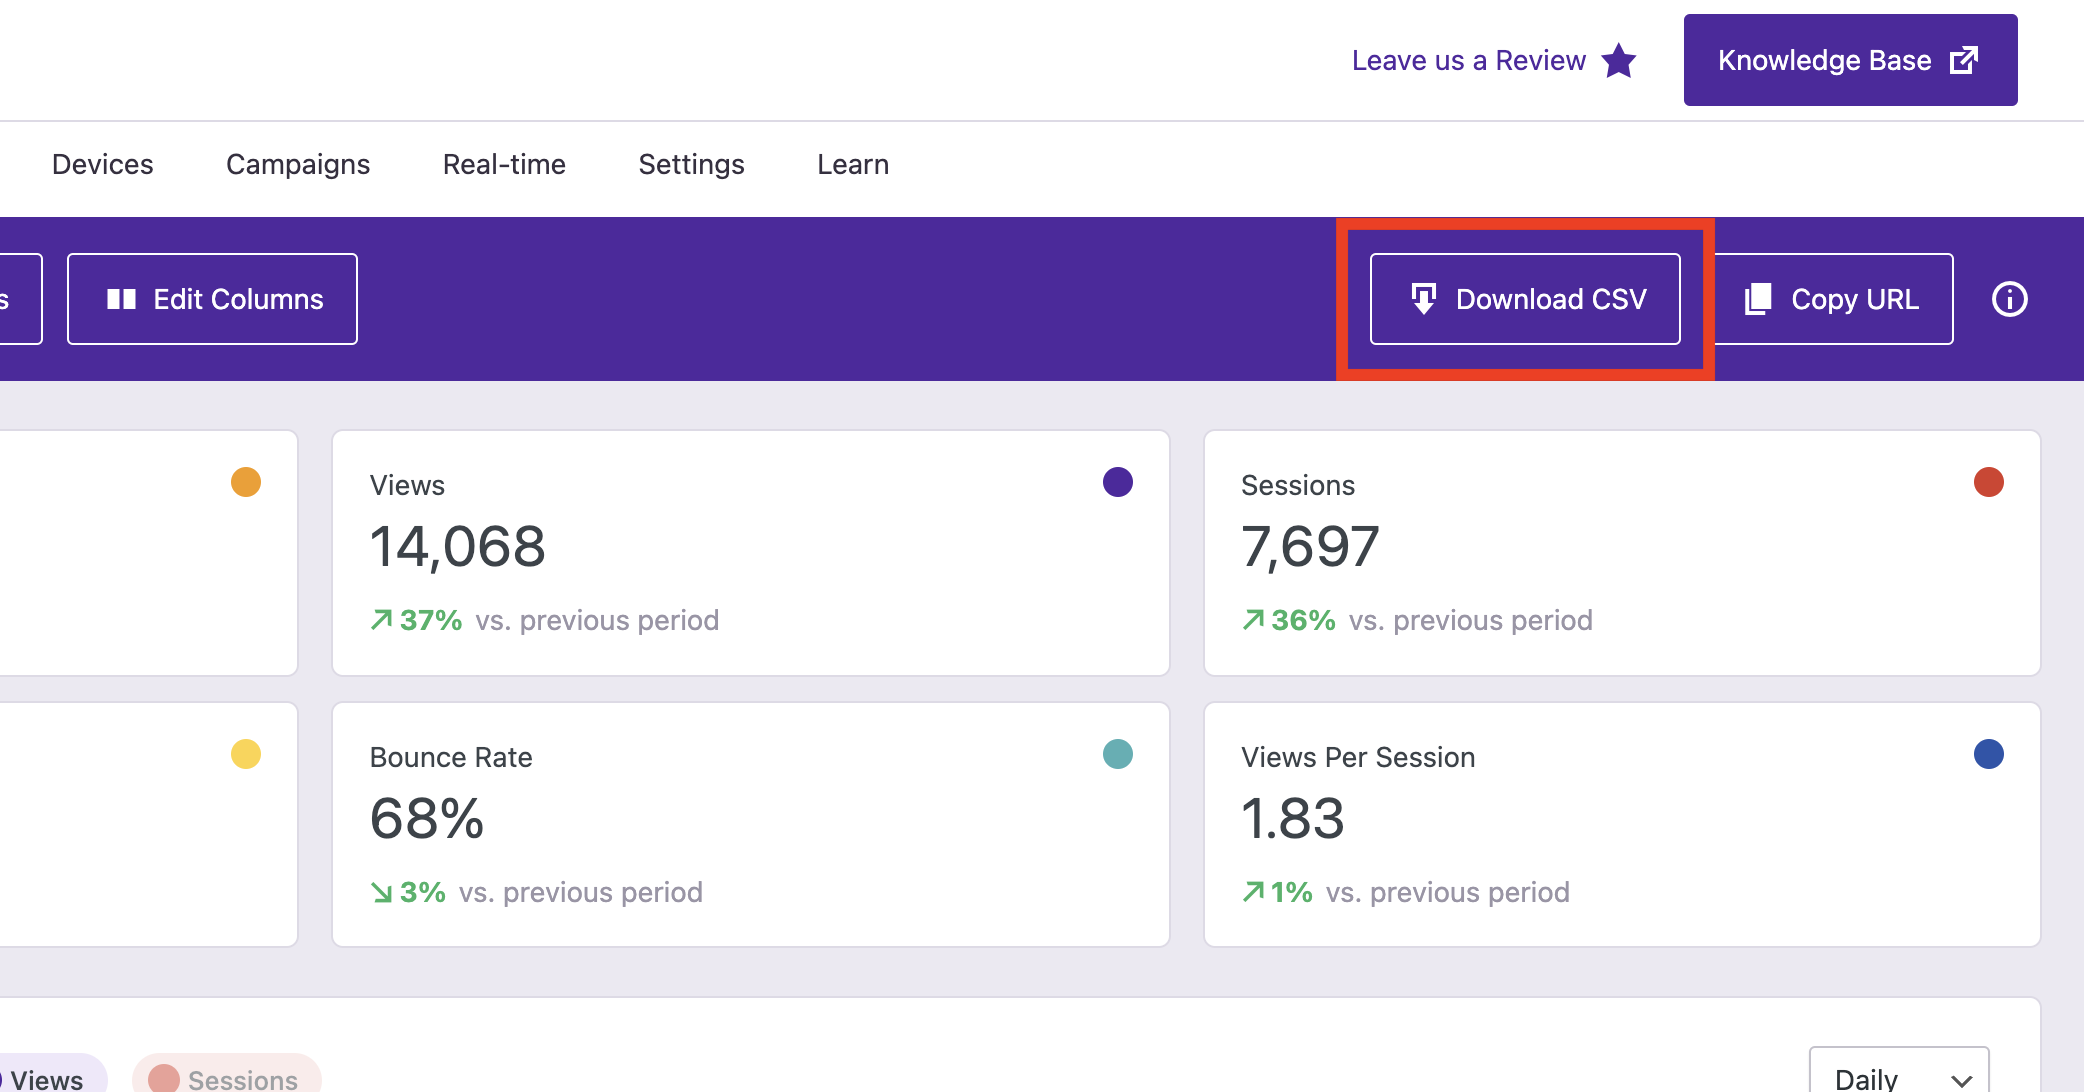
Just click the button, and the data you're viewing will be exported to CSV. It will export the same data you see in the dashboard, so you can customize the date range, filters, columns, and sorting before exporting to modify the resulting CSV.
The export process is extremely fast, so it will only take a few seconds for the CSV to download, even with large volumes of data.
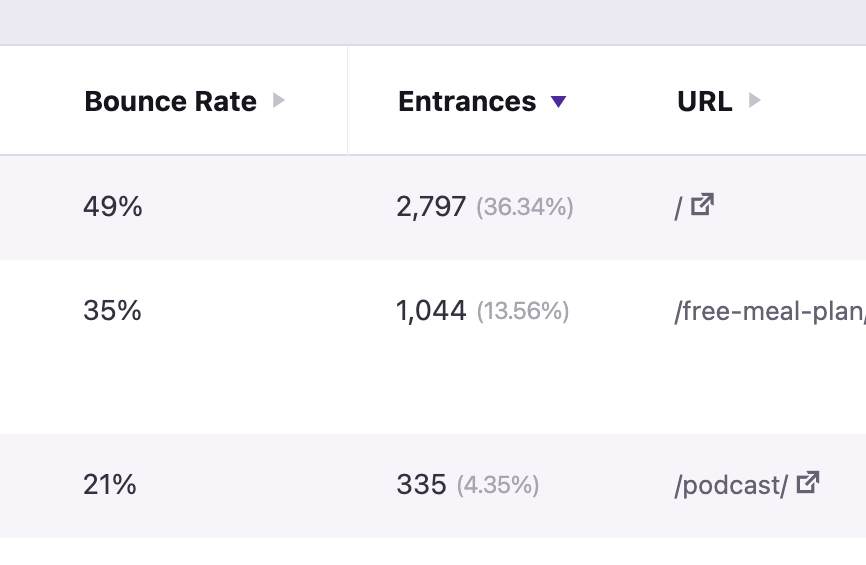
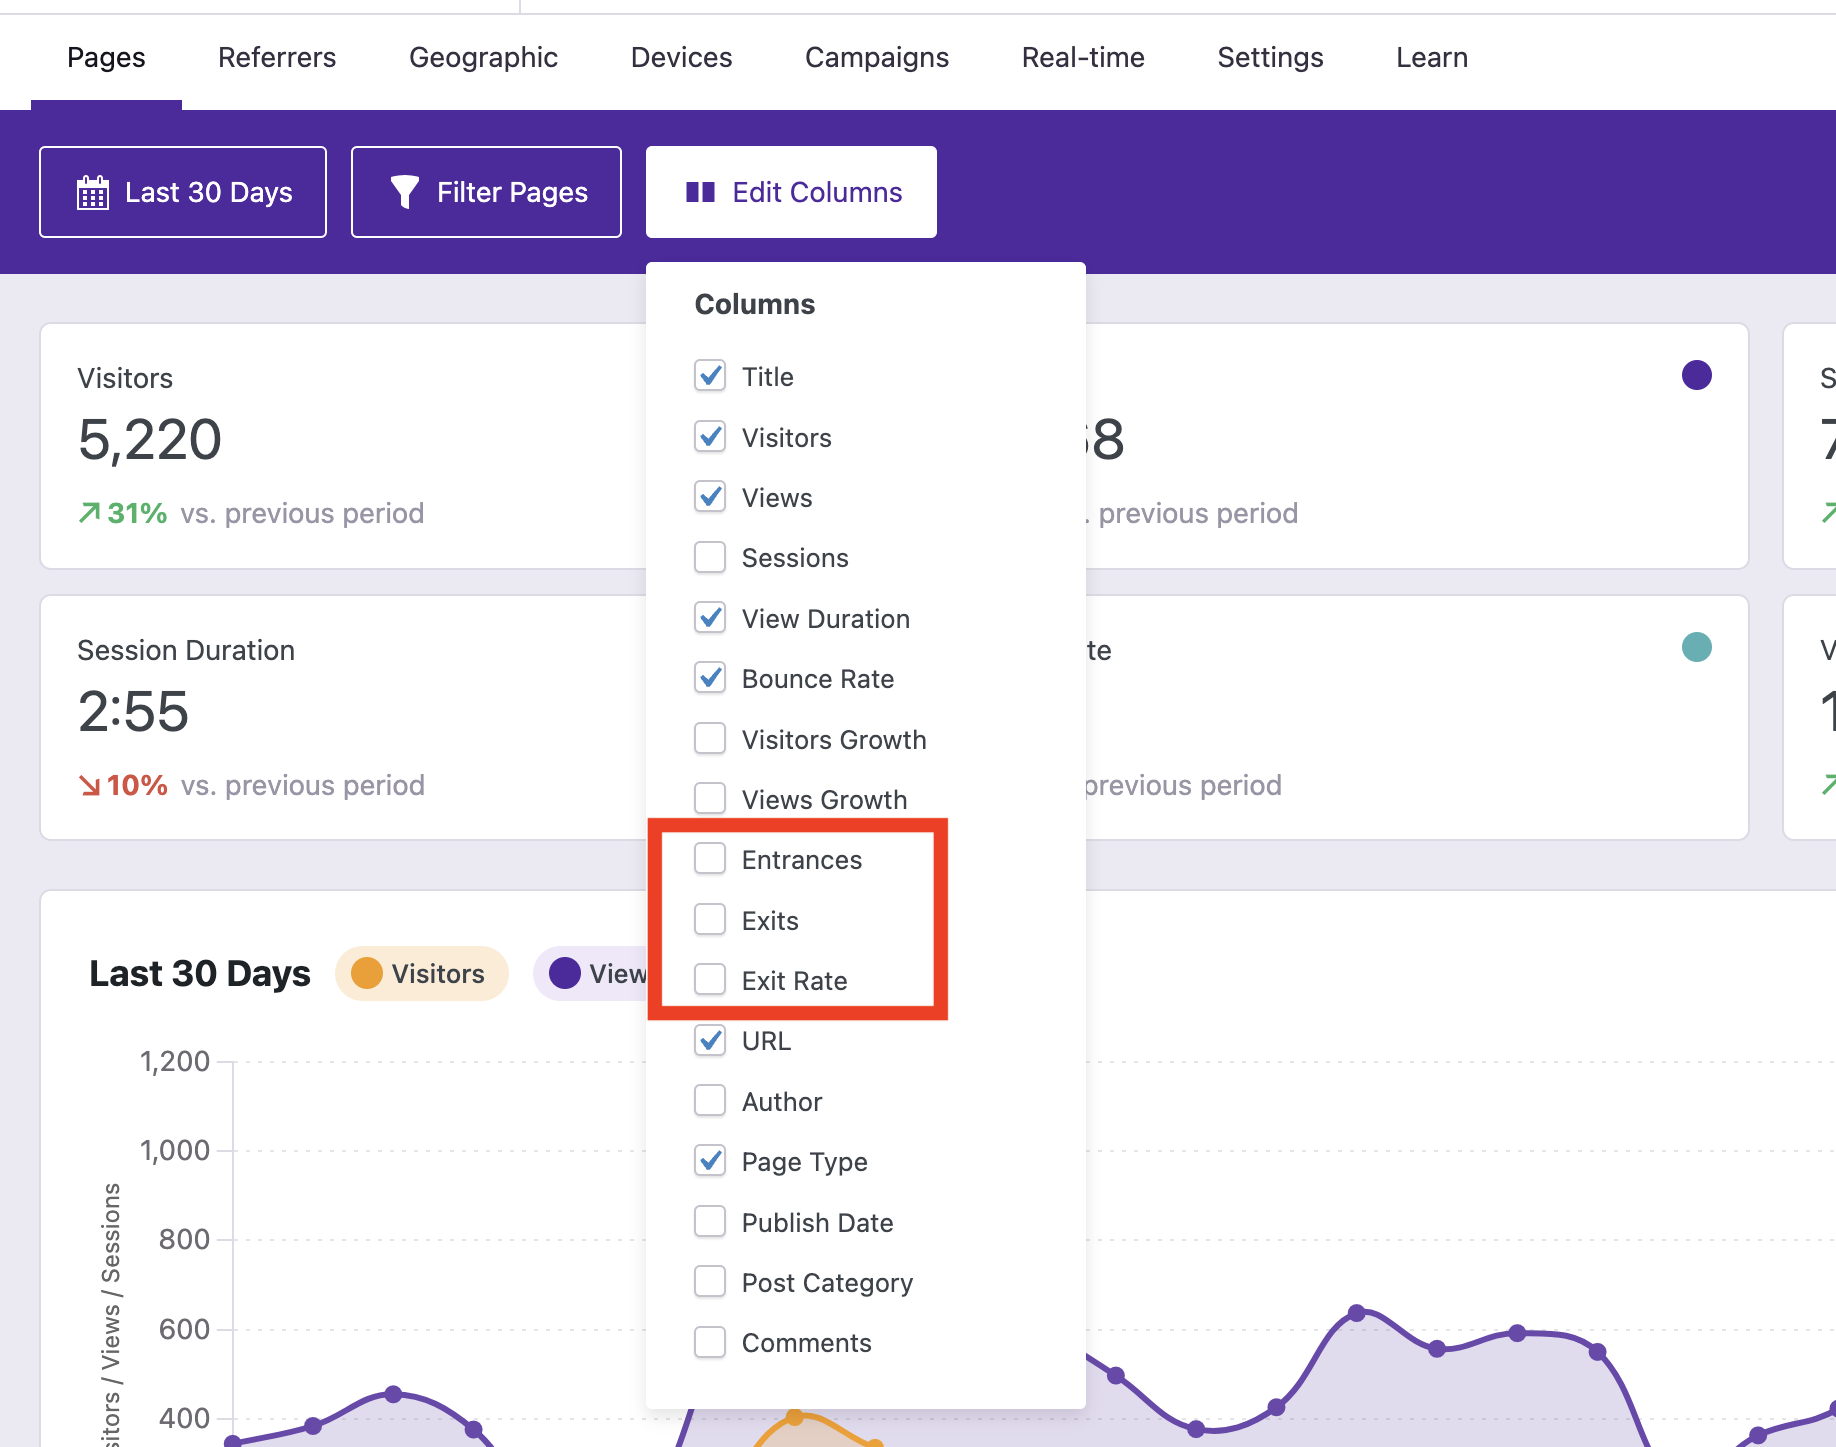
We've had requests for a "landing pages" report, and we decided that instead of creating a whole new report, adding an Entrances column to the Pages report would be even more valuable.
This way, you get all the data already available in the Pages report, and you can simply enable and sort by the Entrances column to find your top landing pages.
In addition to entrances, you'll also find columns for Exits and Exit Rate.
These columns will show you the total exits of each page and how often a page is the last page in a session whenever it's viewed. We have more detailed explanations of the metrics here:
We originally planned to implement Saved Reports over a year ago! But there have been so many other highly requested features that we couldn't delay, so Saved Reports kept getting kicked to a future release. Now, we're finally ready to add this feature, and it's going to be a game-changer.
Saved Reports will allow you to make changes to any report and then save it to revisit quickly in the future. You'll be able to create an entire suite of custom analytics reports catered to the needs of your website.
This is gonna be a big one, and we can't wait to ship this feature and see what everyone thinks.
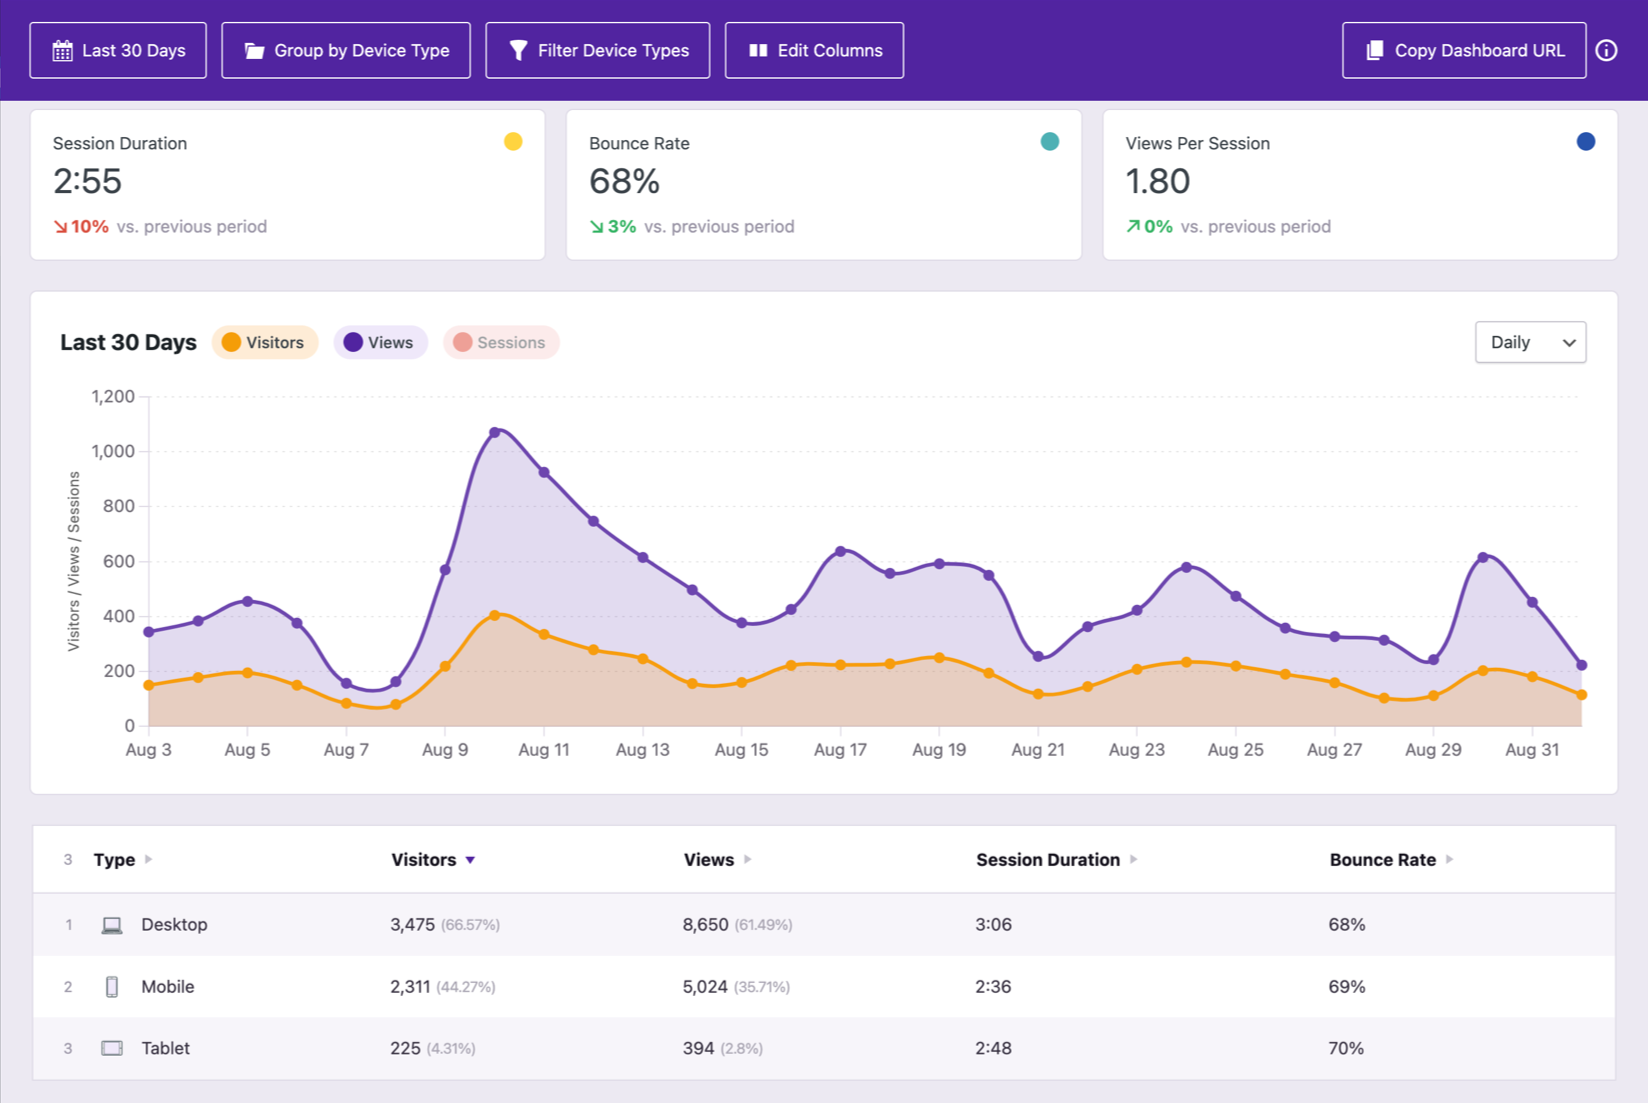
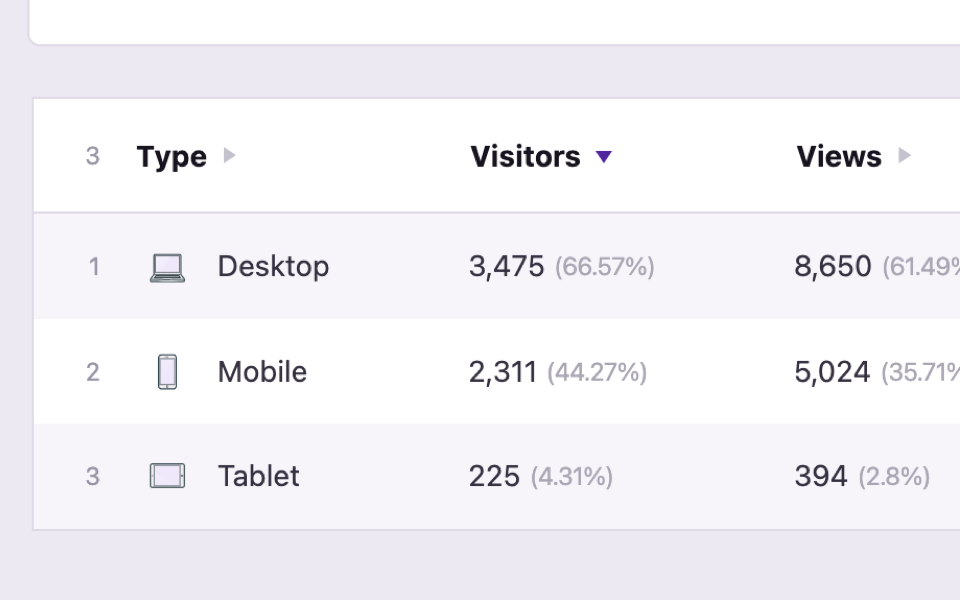
As you can see, it's similar to the other reports, but in the data table, you'll find the device types used to access your site.
Device tracking only begins once you update to v1.29, so the sooner you get onto the new version, the sooner you'll start seeing data in your dashboard.
The default view of this report includes device types and their associated metrics:
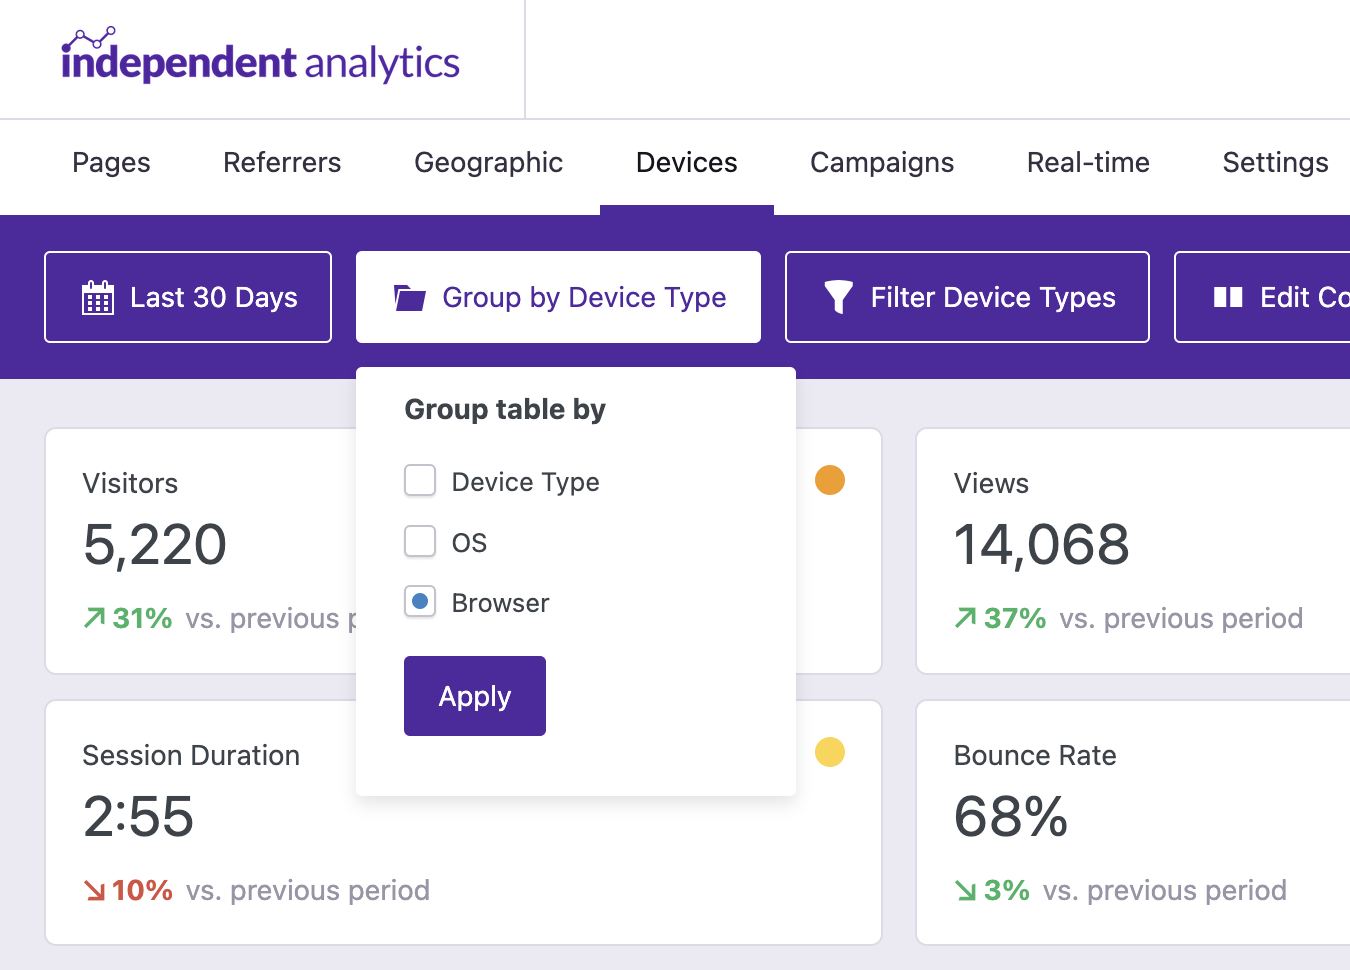
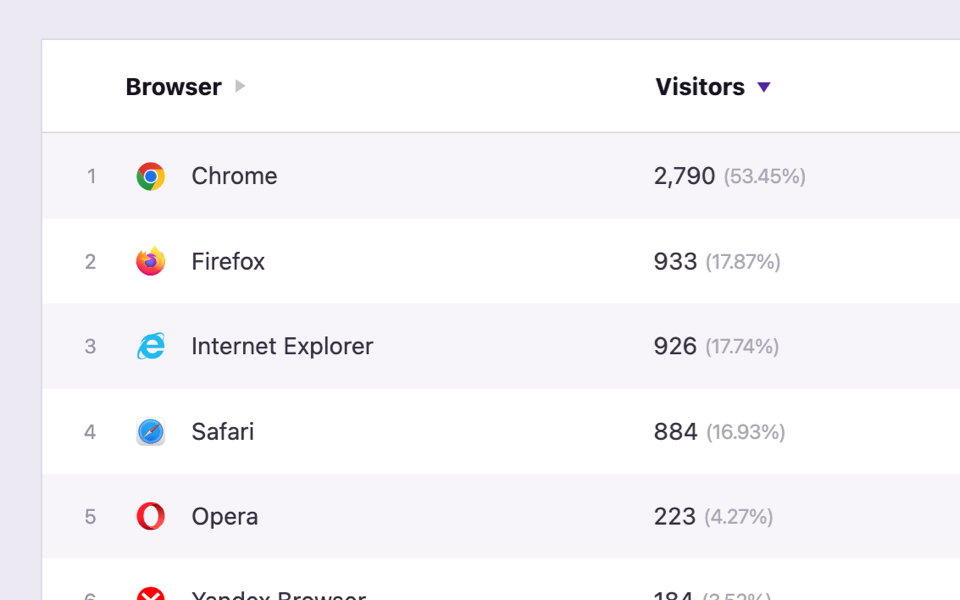
And for our WooCommerce users running Independent Analytics Pro, you might find it useful to compare sales and conversion rates between device types and browsers.
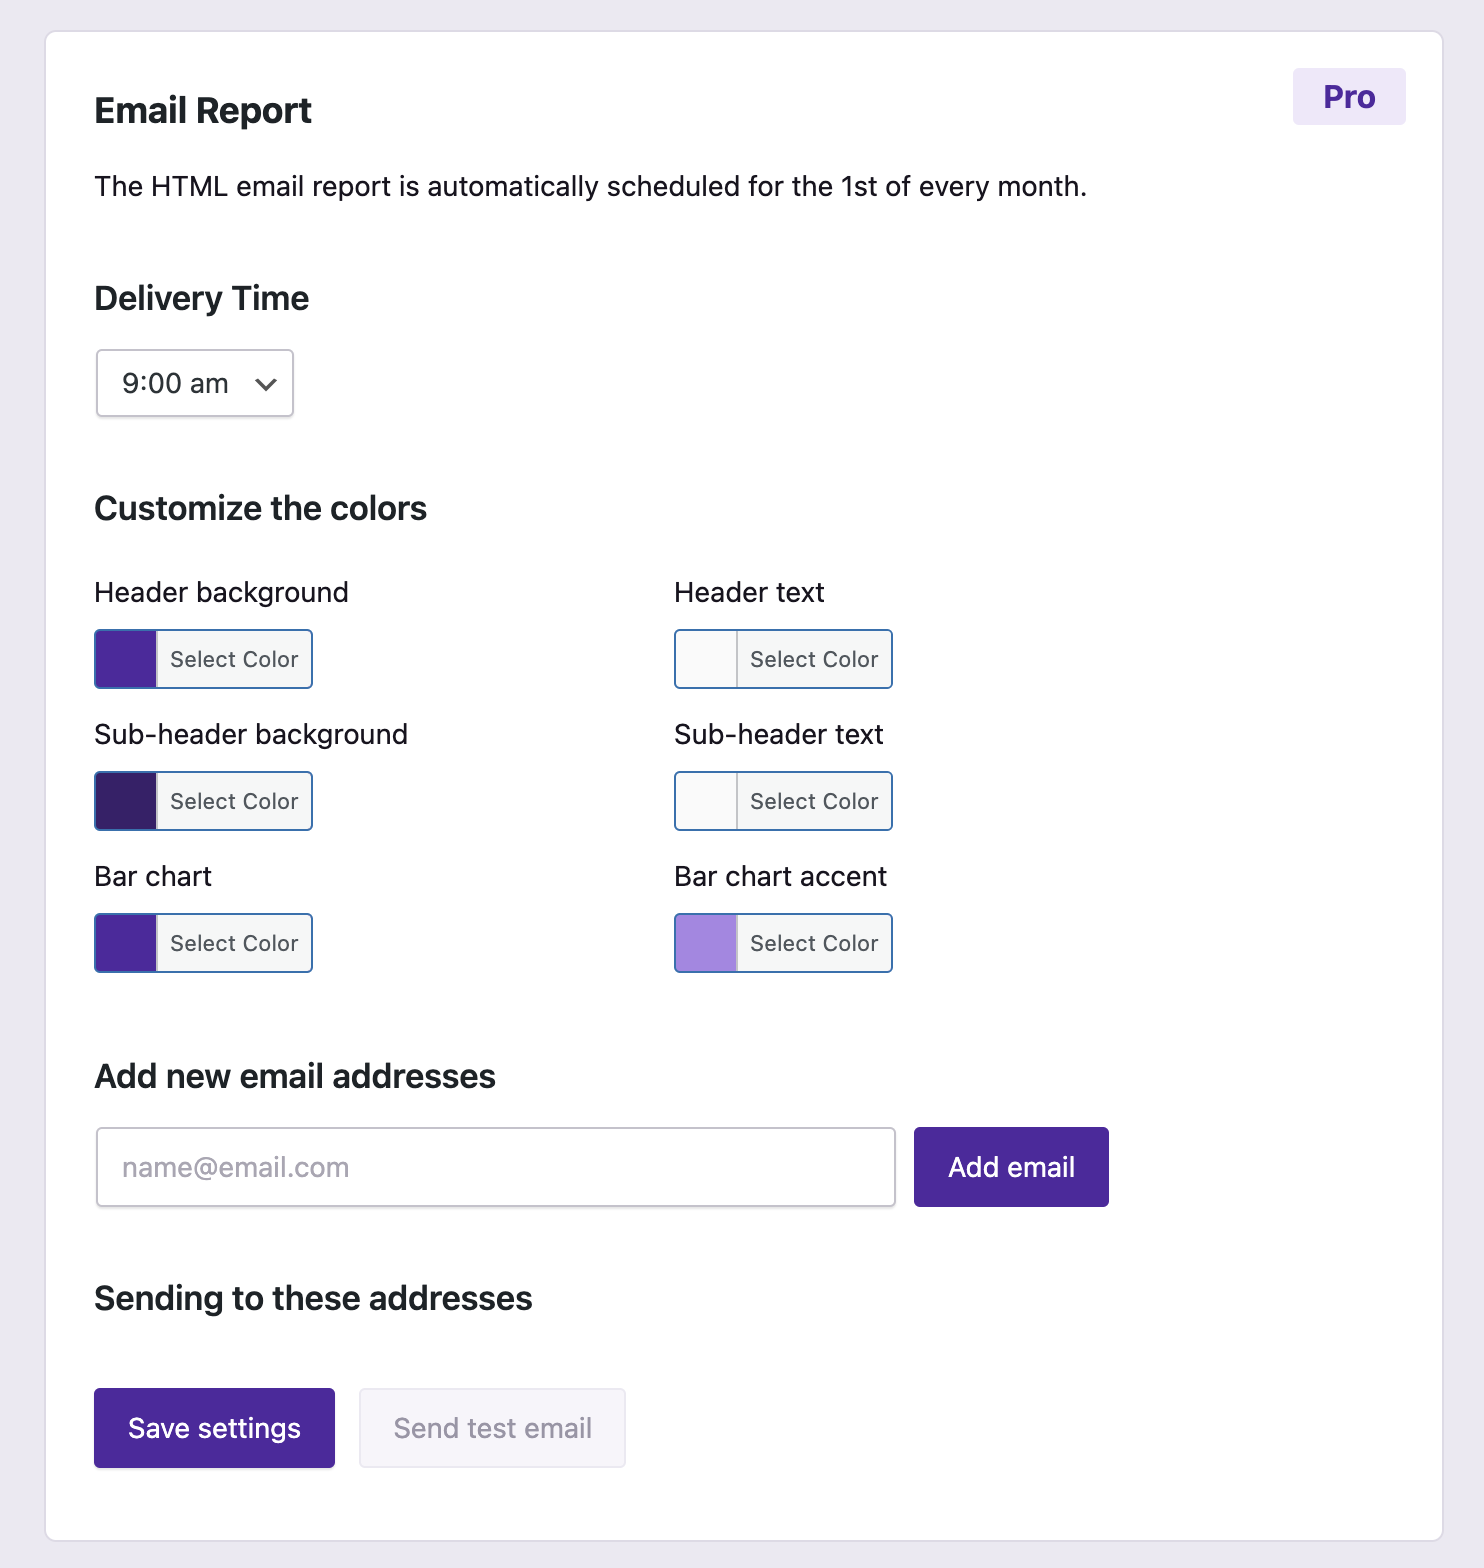
Custom colors for email reports
If you're using Independent Analytics Pro, you'll also want to check out the new custom colors for the email report.
With just a few clicks, you can update the colors in the email report to match your brand (or your client's).
Here's what's next
We're going to keep things rolling in version 1.30 with a few more practical features.
First, we'll be adding table columns for Entrances, Exits, and Exit % to the Pages menu. Rather than creating an entirely new Landing Pages report, we thought it'd be better to keep all the existing data available in the Pages menu, while also making it possible to sort by Entrances to uncover your top landing pages.
Next, we're going to add WooCommerce data to the Pages menu (Pro only). This will let you do things like view the conversion rate of individual pages.
Lastly, we're going to add a CSV export button to the toolbar. Right now, the CSV options are sorely lacking, so with this new feature, you'll be able to export whatever data you're looking at in the dashboard to CSV format.
In this update, we took a break from feature development to focus on back-end optimizations.
These optimizations resulted in savings of around 20% in data storage. Here are the results from a few of our test sites:
Site 1: 32MB -> 23MB (28%) Site 2: 213MB-> 168MB (21%) Site 3: 15MB -> 13MB (13%)
Up until now, we'd been storing the location of each visitor in the database, which caused a lot of redundant data. For instance, if 100 people in Paris visited your site, then "Paris" would be saved 100 times in the database (along with "Île-de-France," "France," and "Europe").
Now, we only save a location once and give it an ID. So those 100 visitors only need an ID, like 35, to reference the location instead of including full location data. This allowed us to delete tons of redundant data, leading to a huge decrease in total storage.
Data accuracy fix in the Geographic report
This optimization was also part of a larger correction to data in the Geographic menu. For sites with large amounts of data, when adding a filter in the Geographic menu, it was possible to experience a limit that would artificially lower the number of views/visitors reported. That has now been fixed.
You should also notice the Geographic report loading considerably faster
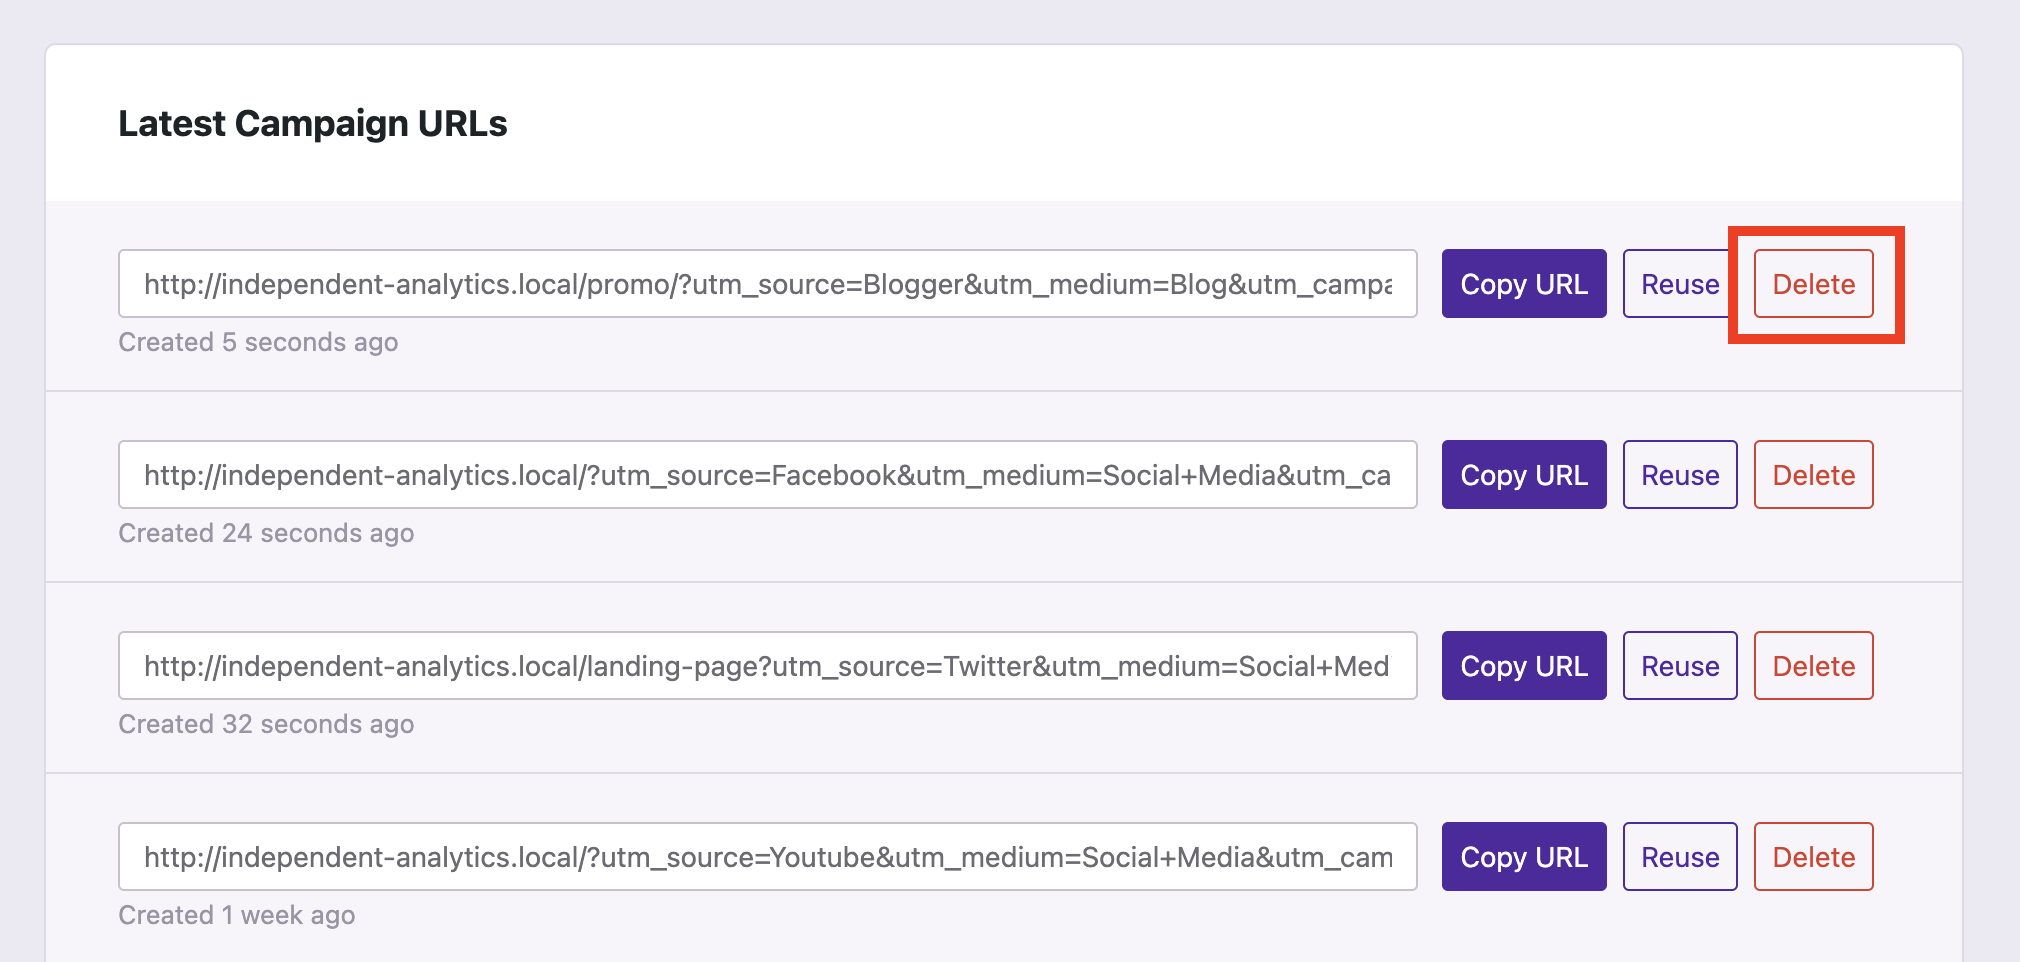
You can now delete campaigns in the campaign builder
For our Pro users, we added the option to delete previously created campaigns in the Campaign Builder menu.
It's pretty easy to make a mistake or create a link you don't end up using, and it's annoying to see it taking up space in the Campaign Builder menu. The new delete button is a simple way to clean up your workspace and remove unwanted campaigns.
Device data report coming soon!
Now that we've gotten these back-end fixes out of the way, we're ready to dive into the device data report!
This is going to be the first new report we've added since the Geographic report, so we're really excited about this feature. It also has more upvotes than any feature so far!
We do our best to stick to a bi-weekly release schedule, but we will likely need more time, given the scale of this feature. We'd love to have it ready in two weeks, but realistically, it may be closer to four.
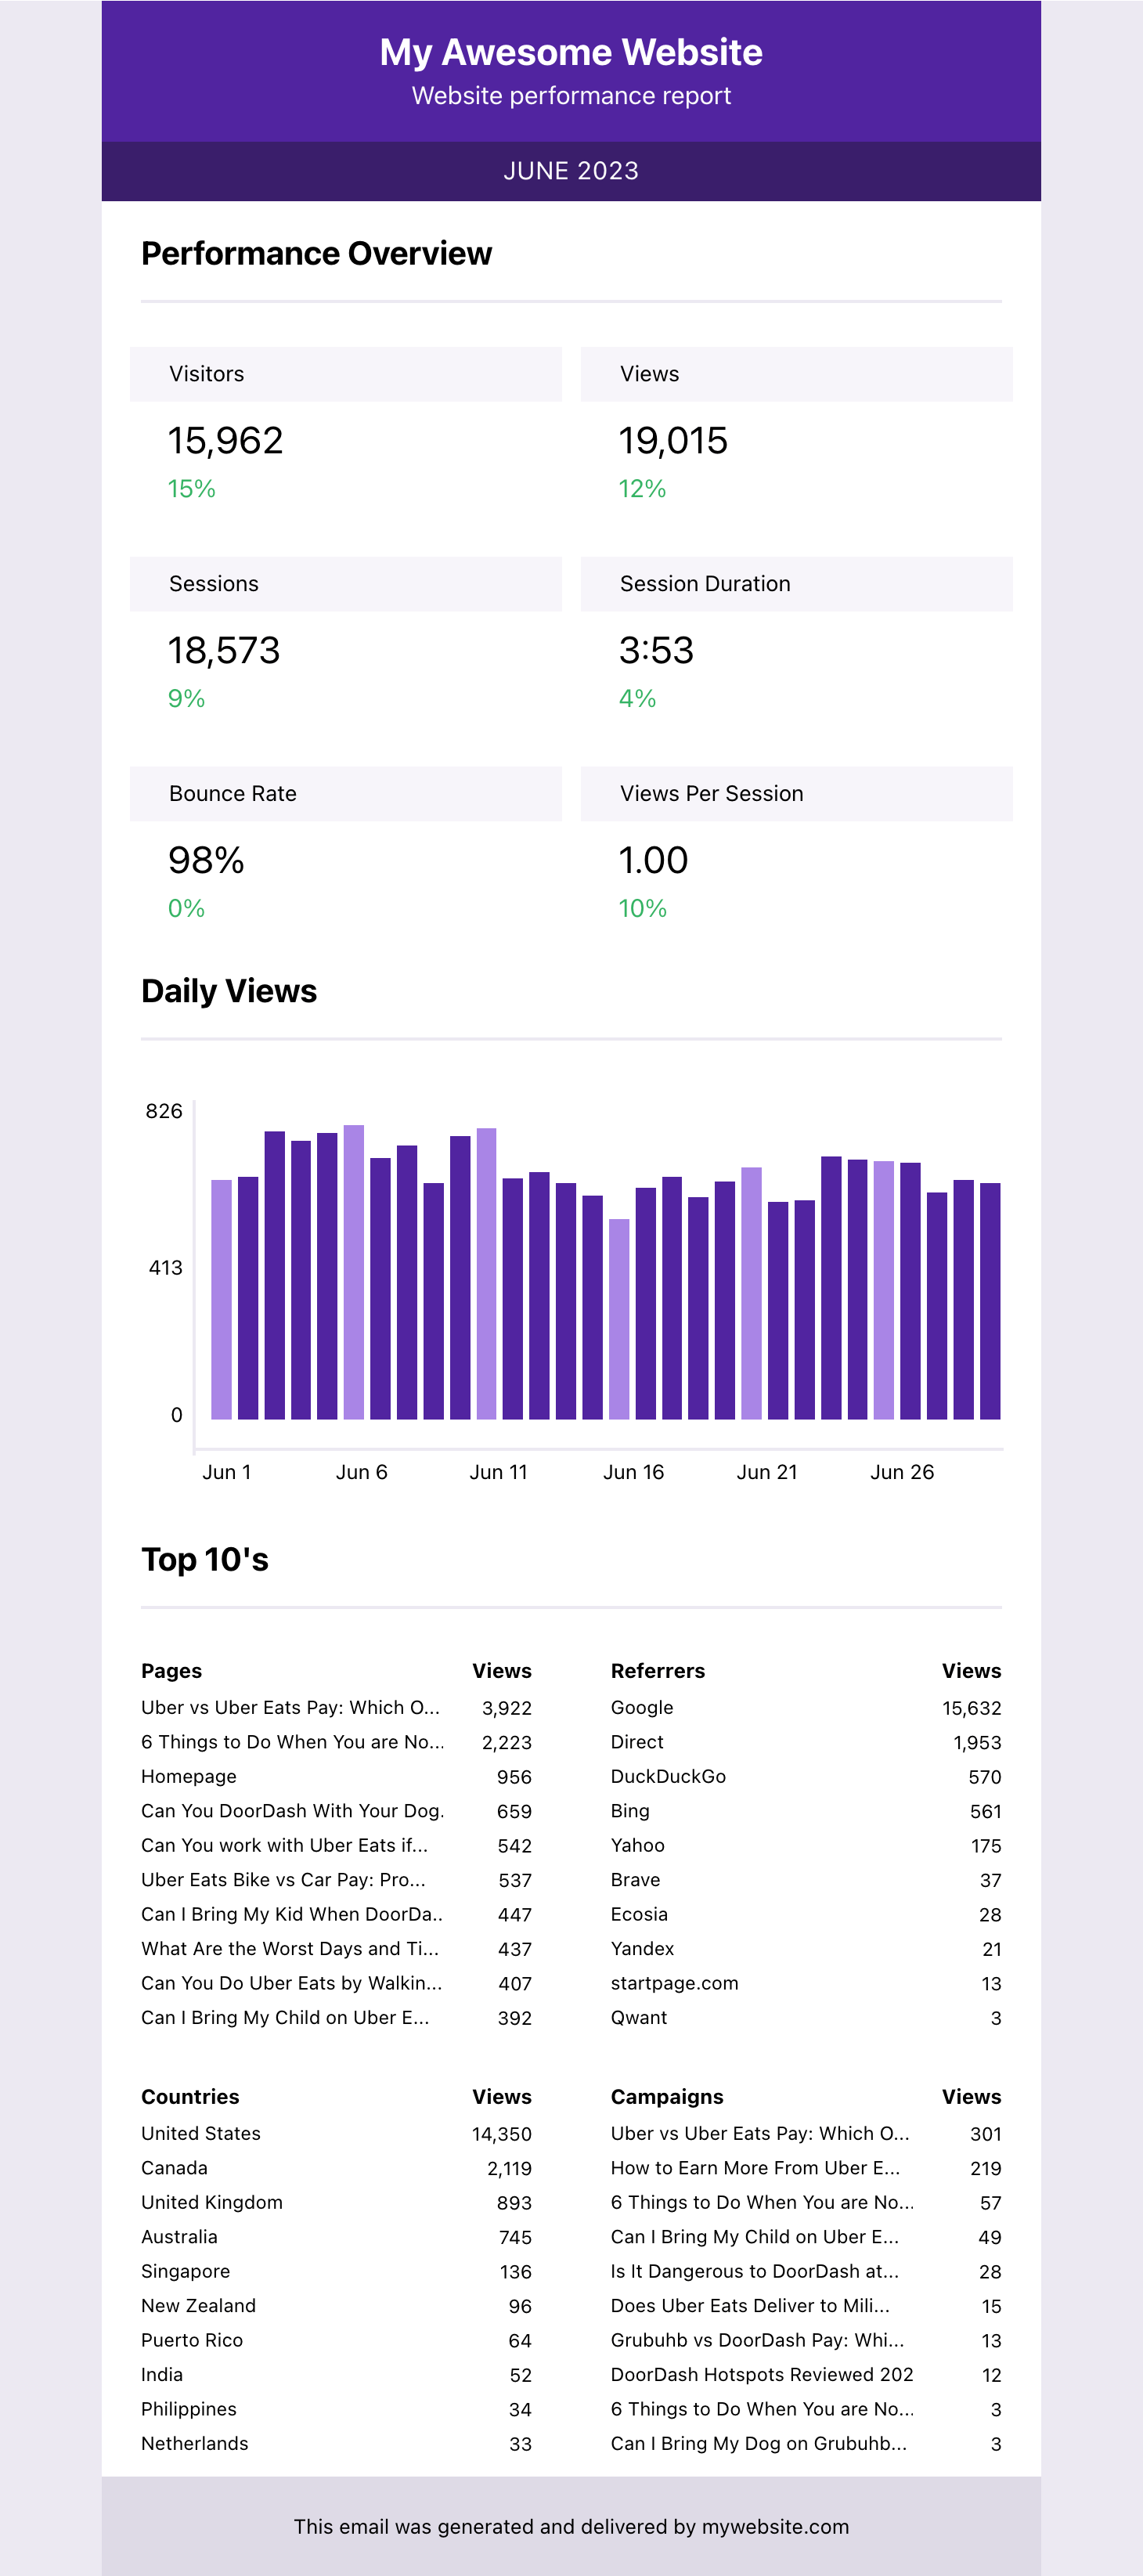
With the PDF, we ran into a lot of formatting issues when splitting the report into multiple pages, which limited us to what we could fit nicely on one page. With the email report, you'll see all of the Quick Stats, a bar chart, and the Top 10 lists.
In addition to displaying more data, the email is also more likely to reach your inbox due to the removal of the attachment. It's also fully responsive, making it easier to access on mobile devices than the PDF.
The email is generated and delivered by your site, so maximum privacy is ensured. No images or external requests are made from the email.
What's next?
In the next update, we are going to make some crucial back-end changes. We'll be re-organizing the way we store visitor location data because it's currently causing issues with the accuracy of filtered results in the Geographic report. Additionally, these changes will vastly reduce the total amount of storage space Independent Analytics requires in the database. We'll have more specifics about this optimization in the next changelog post.
And once our next update is done, we'll be ready to tackle one of the most highly-requested features so far: device data!
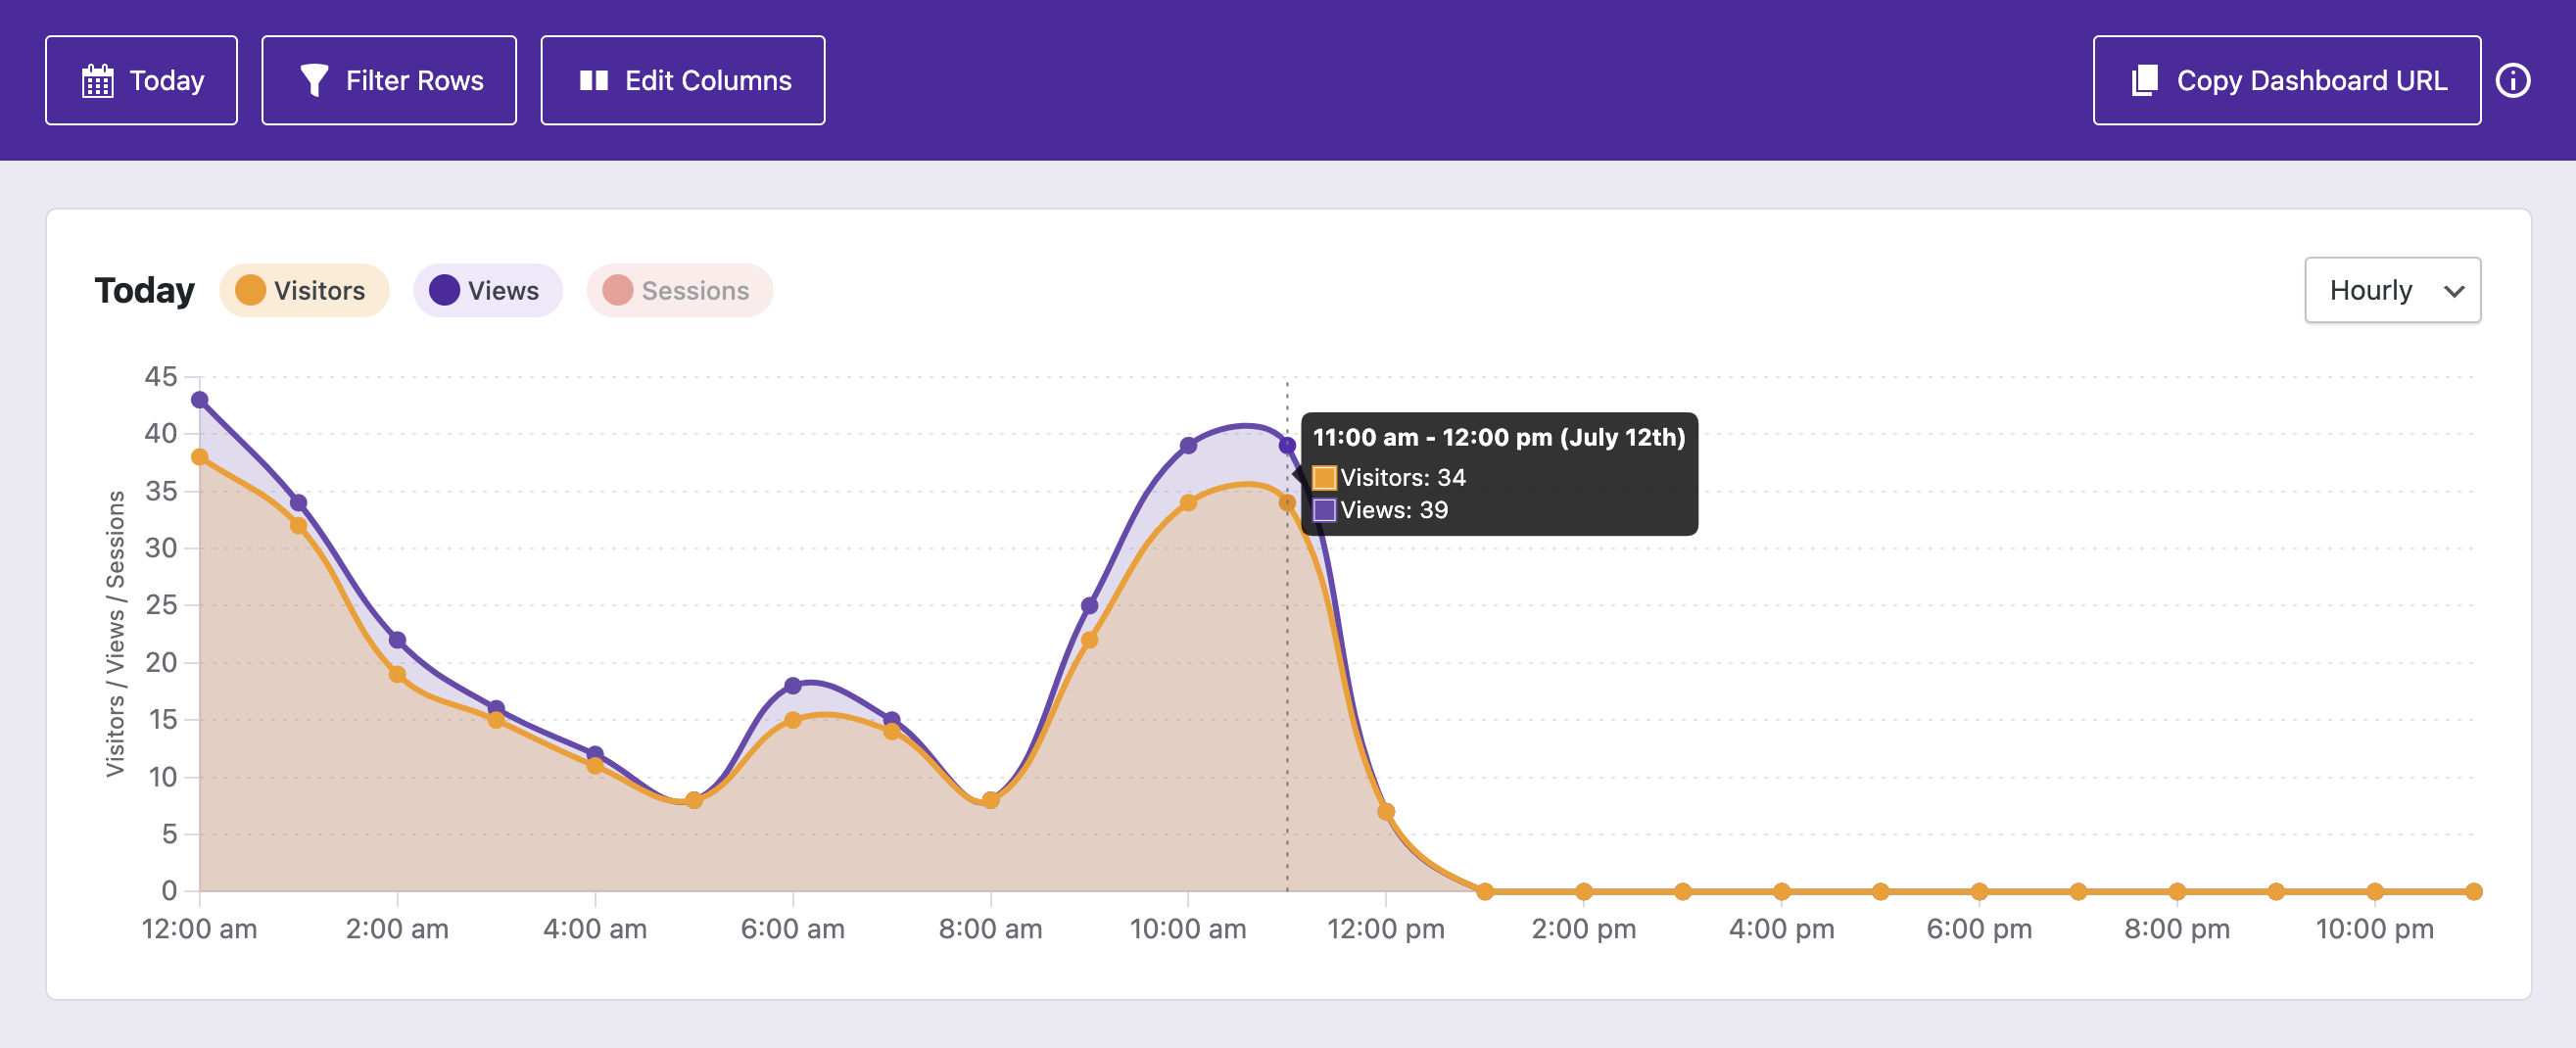
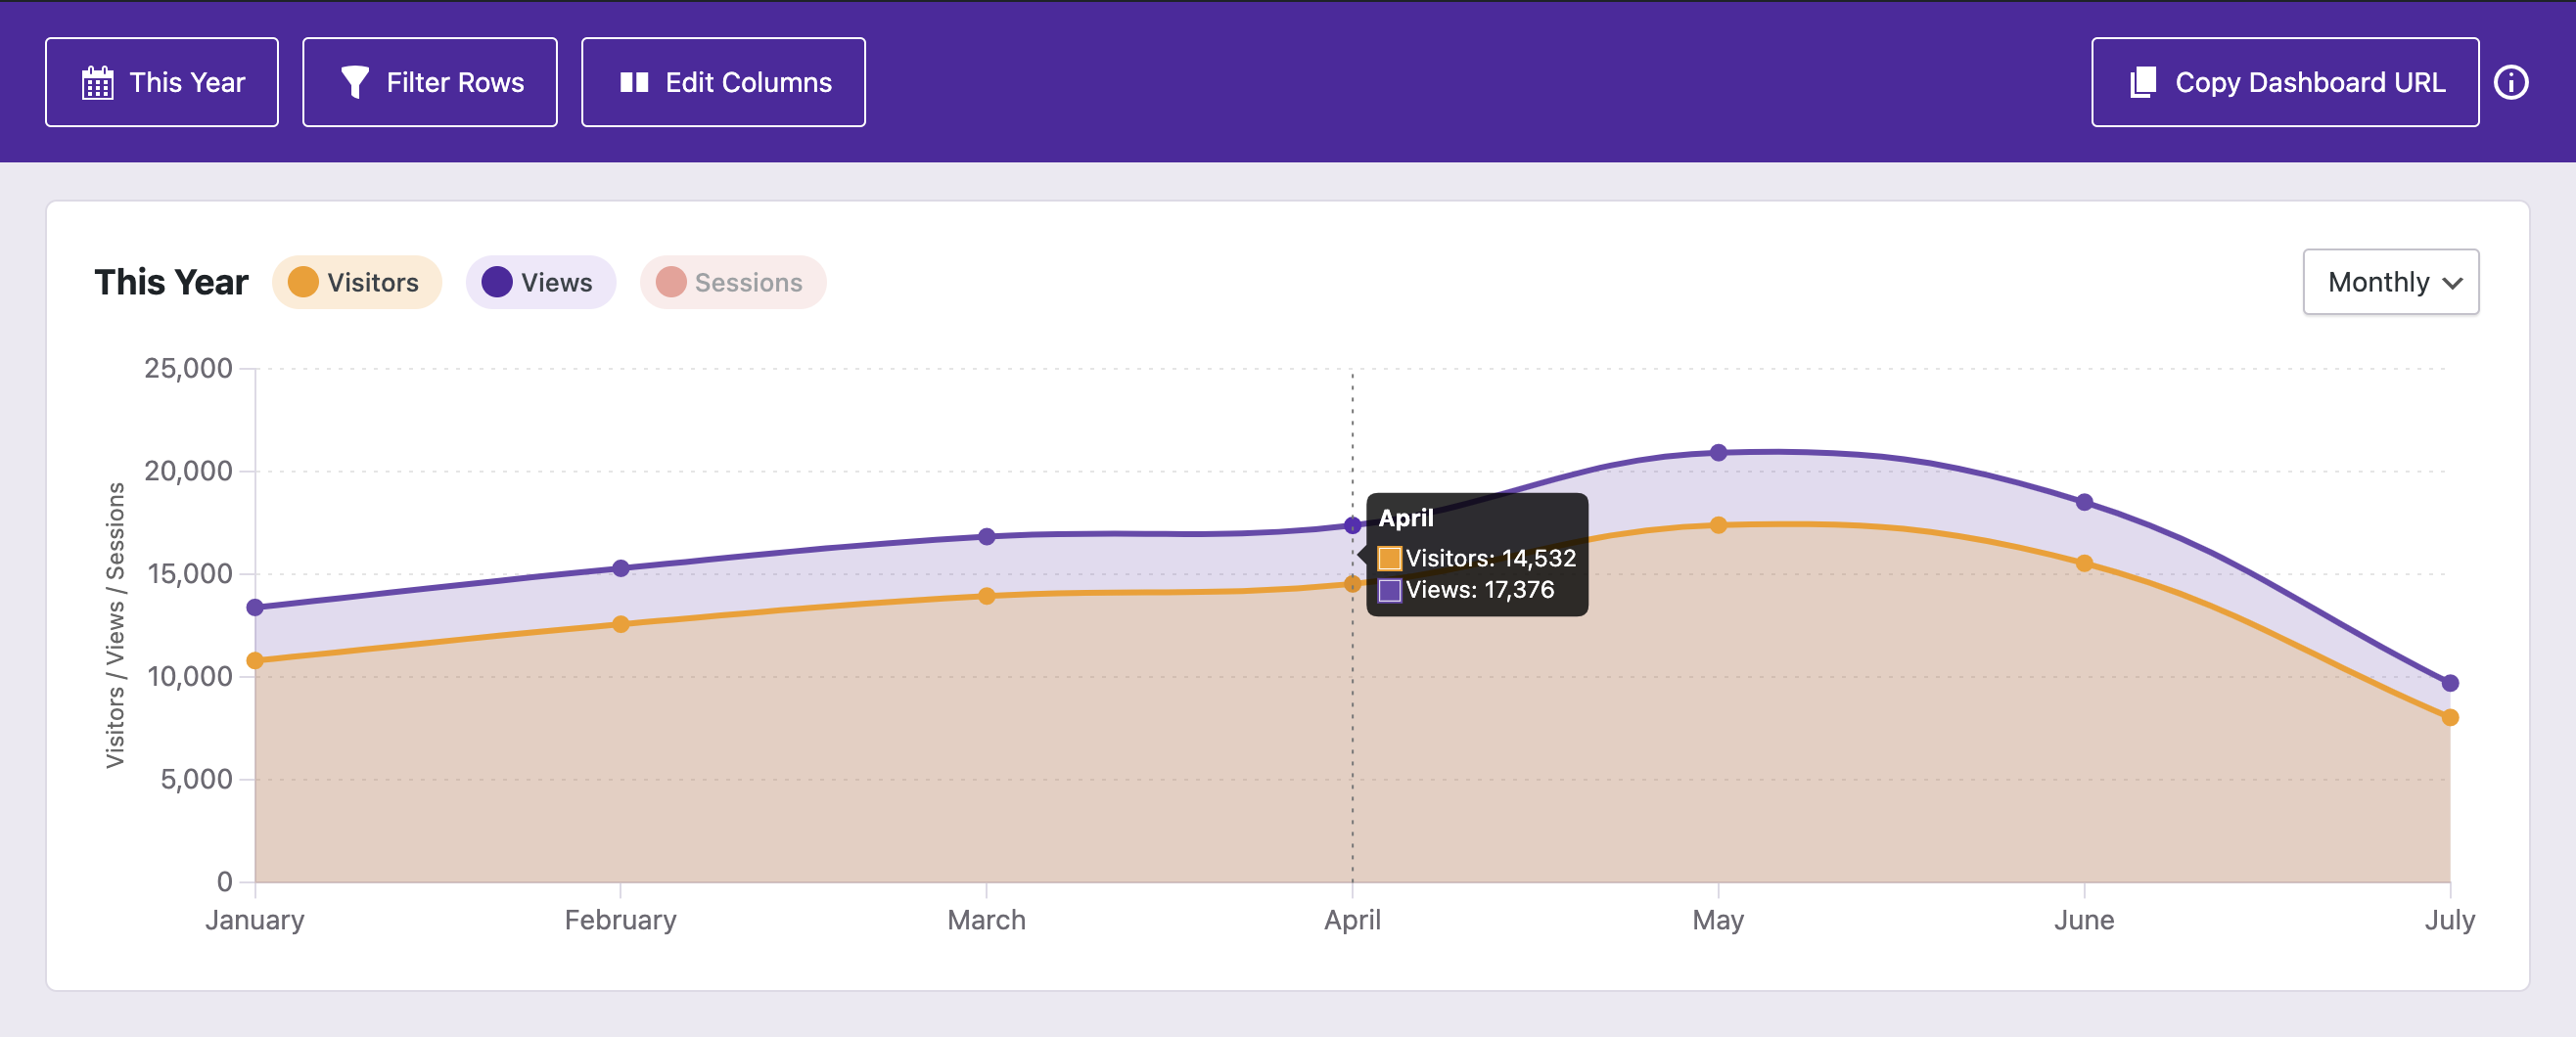
While the chart will choose the most appropriate interval for the date range you select, you can manually switch between them as well using the new interval select:
This update was mainly about adding the new chart intervals, but we also made a change to truncation.
In order to better fit large numbers, we applied truncation to the quick stats in the previous update. However, we overdid it and truncated smaller numbers that didn't really need it.
Moving forward, only numbers that are six figures or greater will be truncated (100,000 => 100K).
What's next?
We are seeing some issues with data accuracy when filtering geographic data for sites with large amounts of traffic. For this reason, the next update is going to include a lot of back-end changes to optimize how filtering works.
For Pro users, we're also going to redo the email reports. The PDFs aren't working out, so we're switching to an email-only format where the stats will appear in the email rather than an attached PDF. This should be easier for everyone to access, and it will allow us to include a lot more data than currently appears in the PDF.
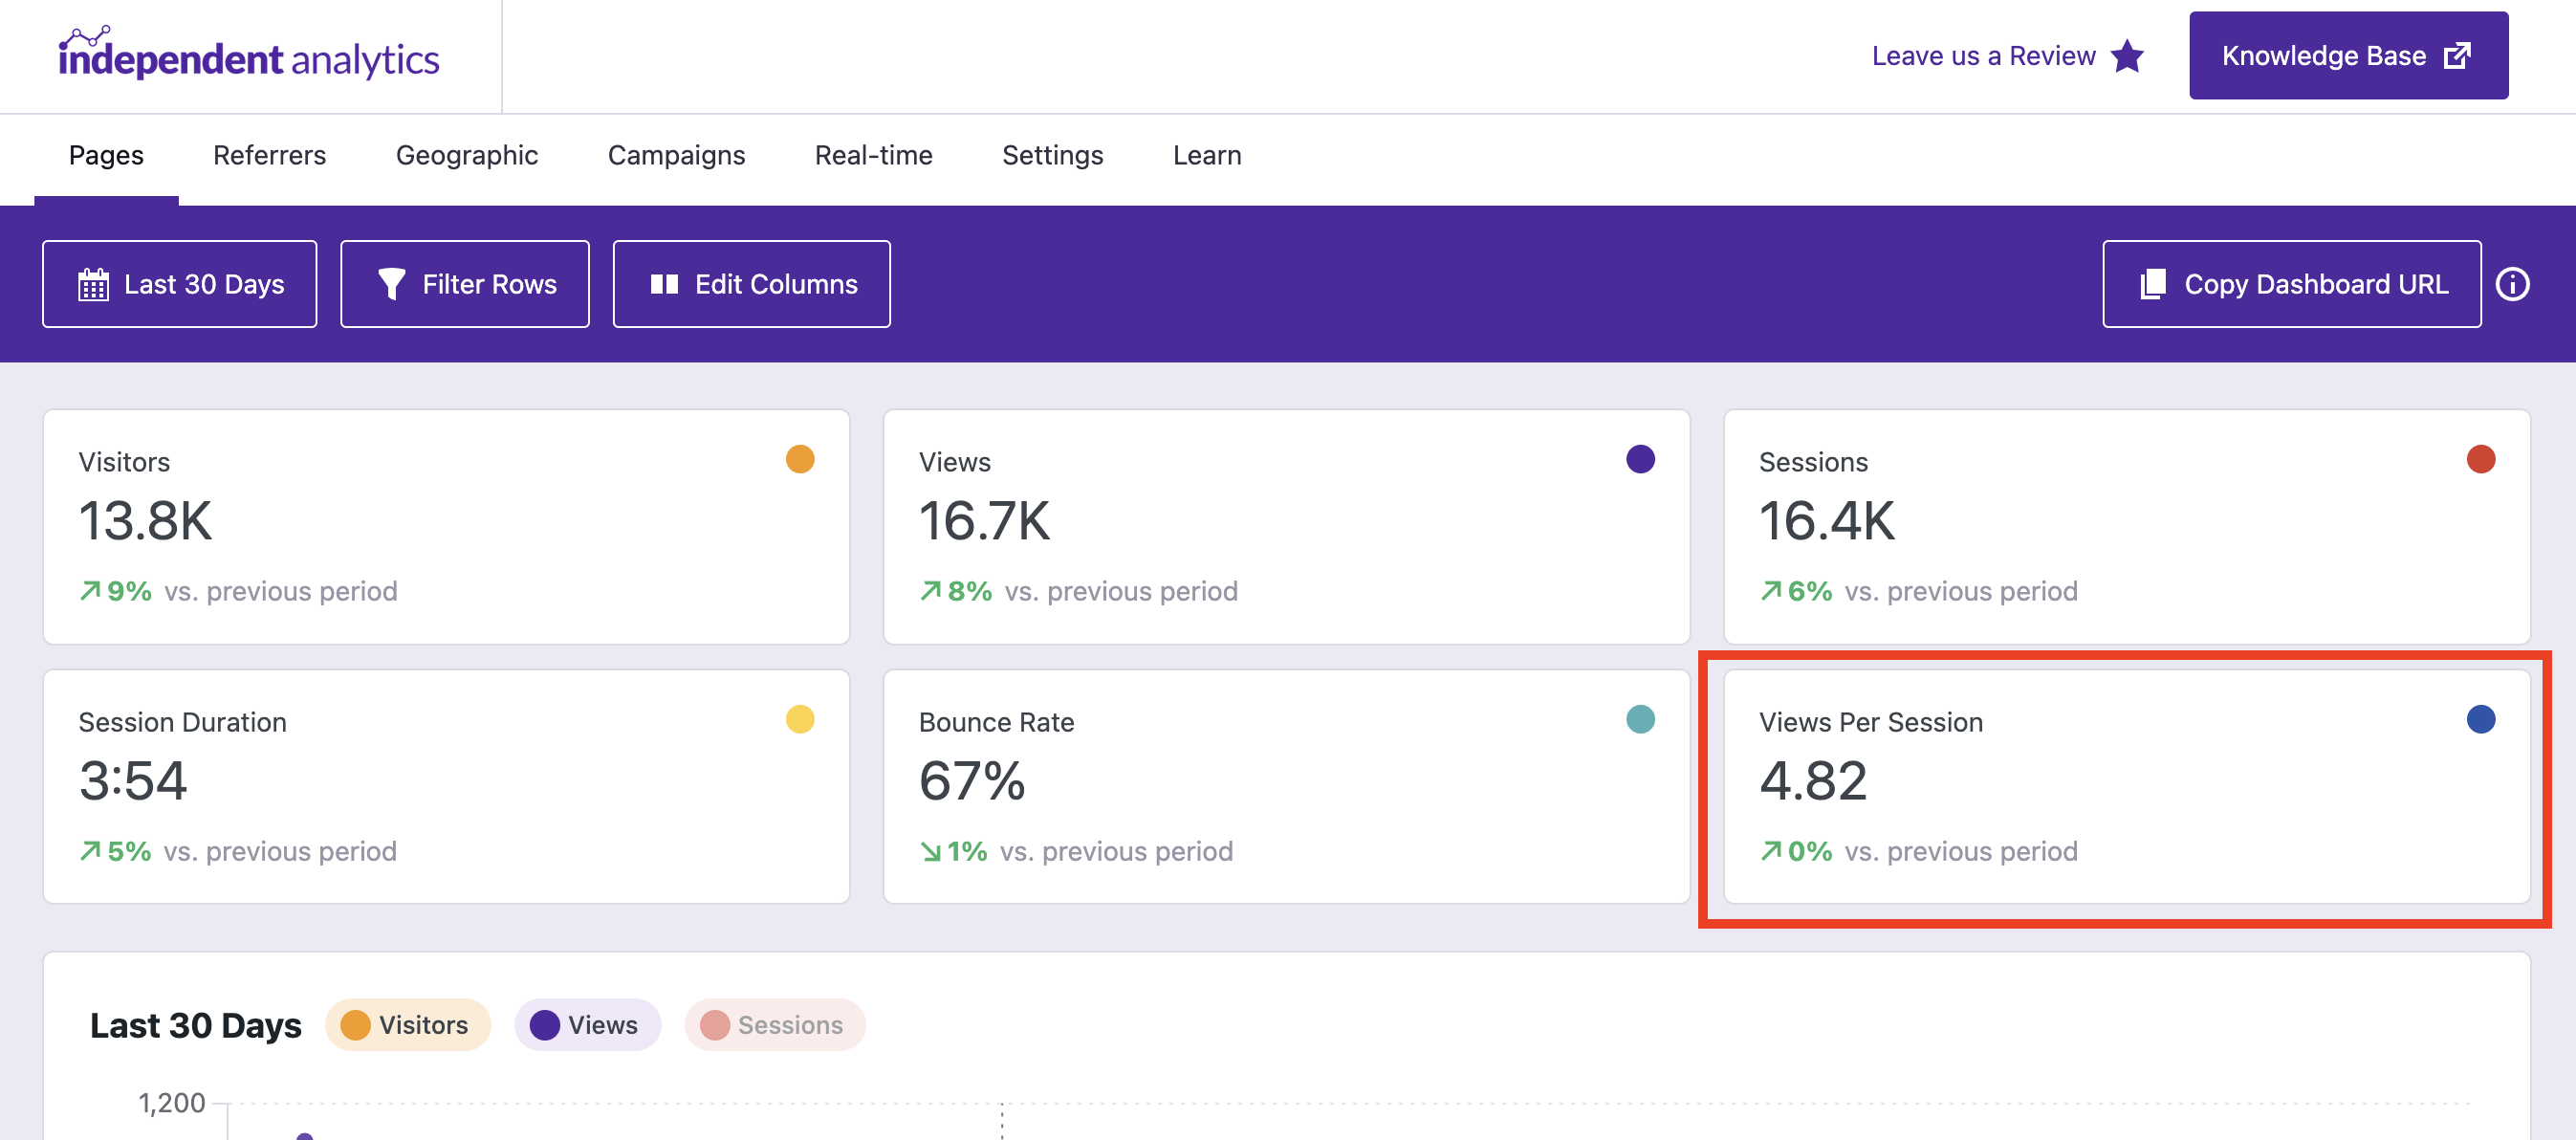
This lets you know how many pages visitors view (on average) each time they visit your site. We have more info about this metric here if you want to get into the nitty-gritty details.
Those two changes dominated this release, so not much else changed besides a fix for a rare error that interrupted the installation on some sites.
What's next?
In the next release, we are going to update the chart so that you can see hourly data. As it is now, the chart is pretty useless when looking at data for only today or yesterday, and we'd like to change that.
For our Pro users, we will also be converting the email report from an attached PDF to an HTML email. We found that PDFs are too unwieldy for us to design the way we want, and it should also be easier for everyone to simply look at the email for their stats instead of downloading a PDF, which is especially unfriendly on mobile.
Bounce Rate tells you the percentage of visitors who only viewed one page before leaving the site. It's great for getting a high-level understanding of engagement. Make sure to check the bounce rate for your referrers and campaigns in addition to your pages and overall bounce rate.
Admin Bar stats
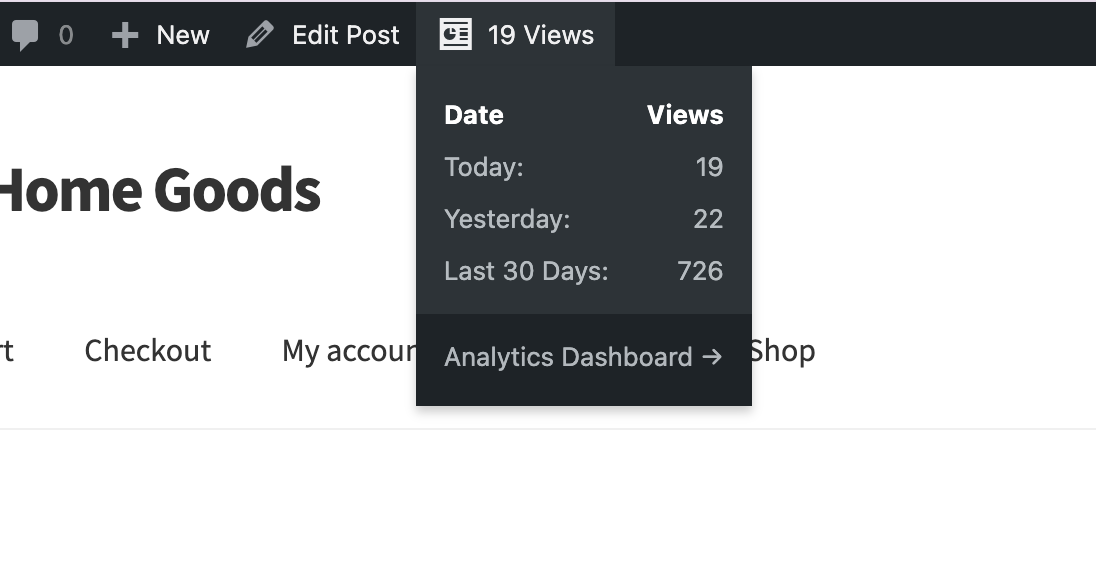
Another feature you'll find in v1.24 is the new Admin Bar stats.
The stats show up on the front end of the site as well as in the post editor. This makes it easy to see how many views the current page has had today, yesterday, and the last 30 days.
No more deactivation feedback
We made a handful of other small improvements, but one that stands out is the removal of the deactivation popup. This would normally show up when deactivating IA, asking for a reason for the deactivation.
This is included by Freemius by default, but we found that the feedback wasn't as useful as we'd hoped, and it's pretty annoying for everyone. For those reasons, we stripped it out completely, so you won't be pestered by it again.
What's next?
There are two features we'd like to add in the next release.
First, the Pages per Session metric has been highly requested, so we're going to add that to wrap up our series of new metrics.
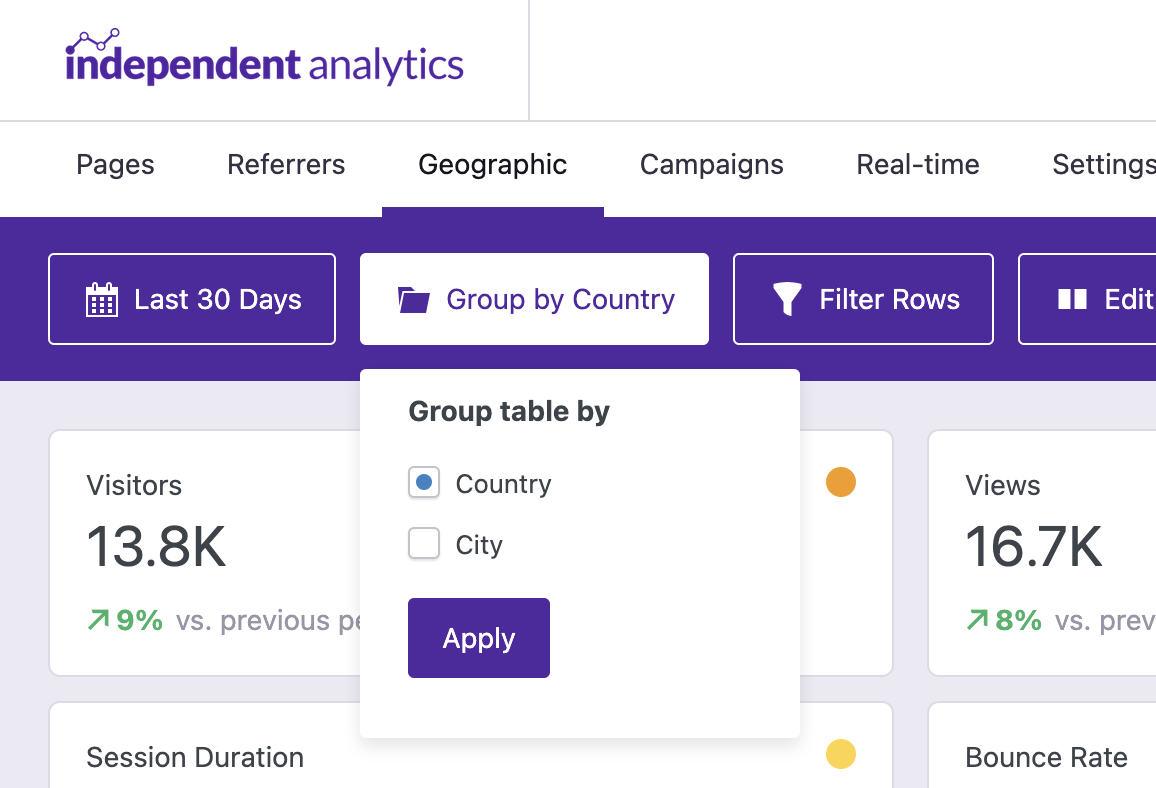
And second, we're going to update the Geographic menu so that the table can be grouped by country. We don't want to get rid of city-level data, but most people would prefer to see a list of countries, and we want to make that possible.
Further down the line, we still have our sights set on Saved Reports, Event Tracking, and Outbound Click Tracking, so you can look forward to those additions in the coming months.
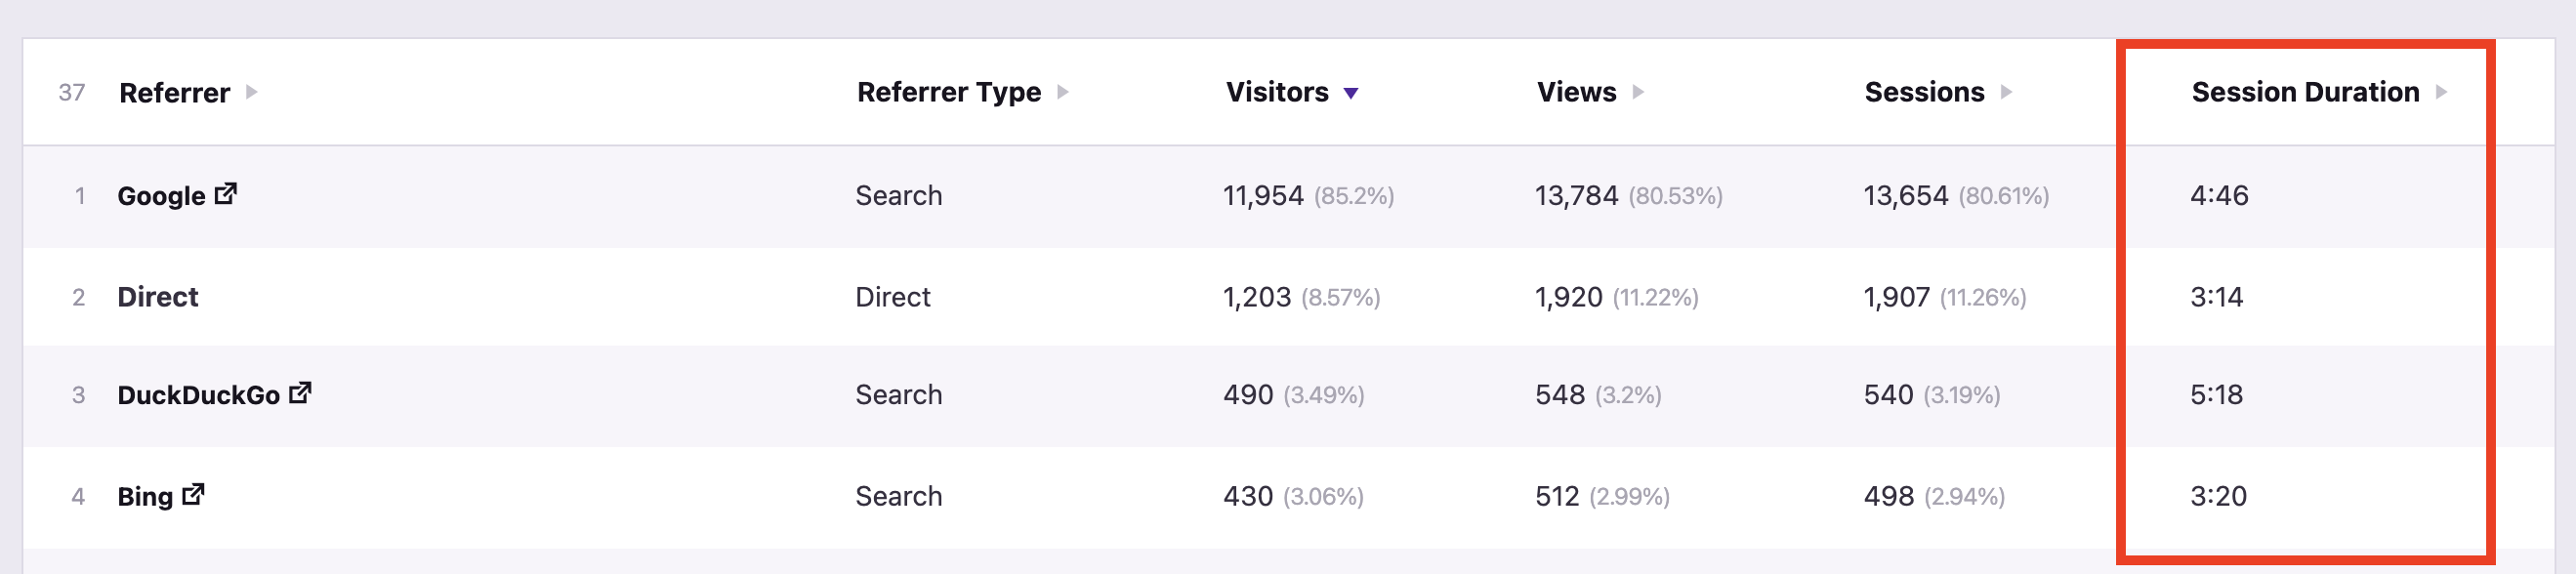
Session Duration tells you how long people spend on your site when they visit, on average. This metric appears in the Quick Stats of each page, and it also shows up in the table for referrers, geolocations, and campaigns.
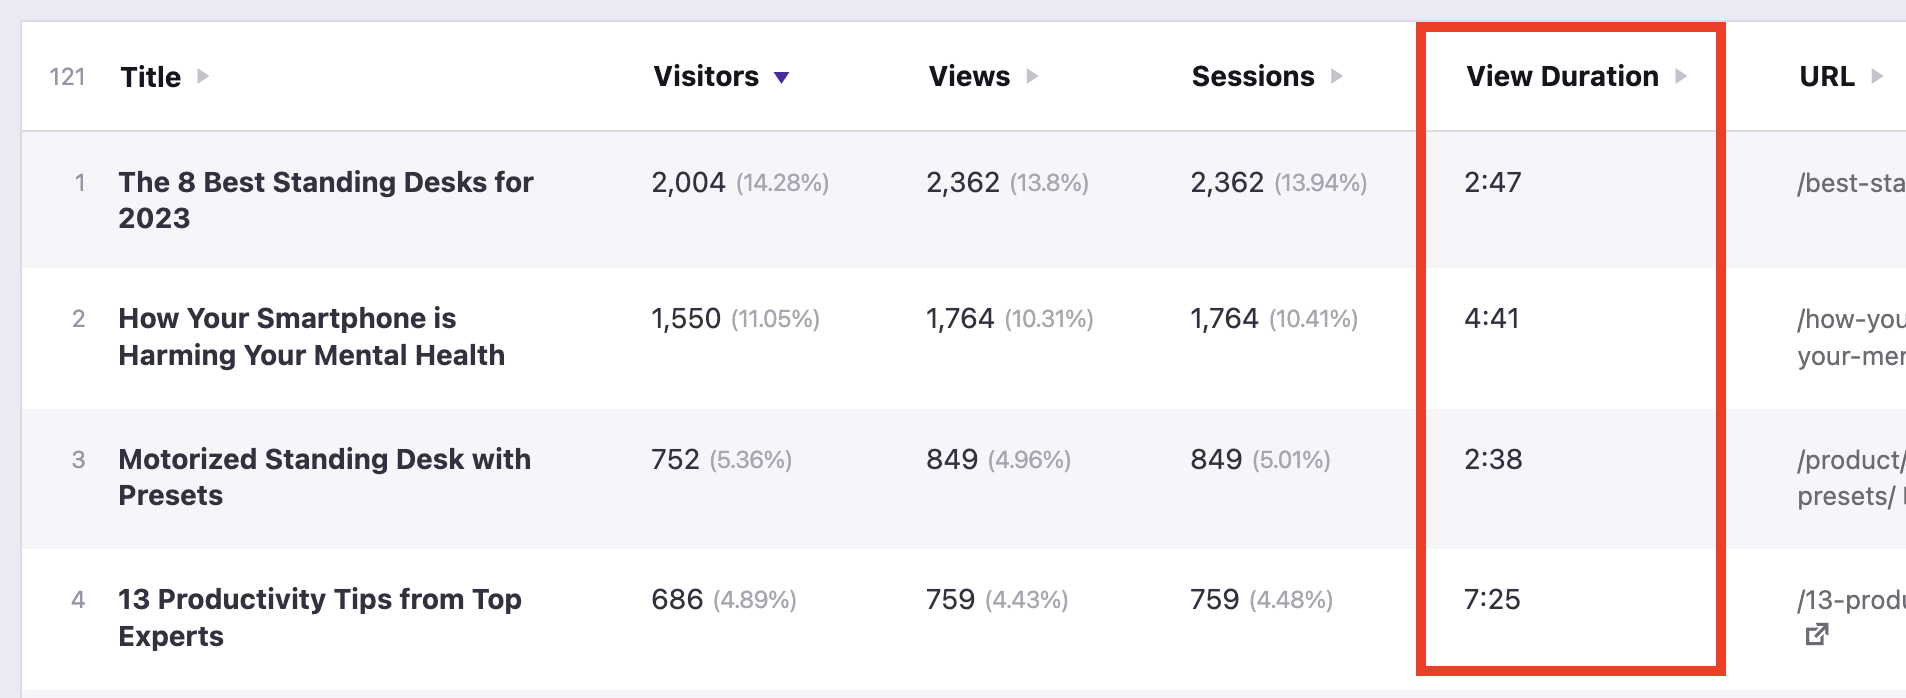
For the Pages menu, you'll see View Duration instead of Session Duration in the table. View Duration tells you how long visitors look at a page, on average.
Since these metrics are built off of our session-based tracking system, they're available retroactively. In other words, you can see Session Duration and View Duration for the past few months rather than starting today.
What else happened?
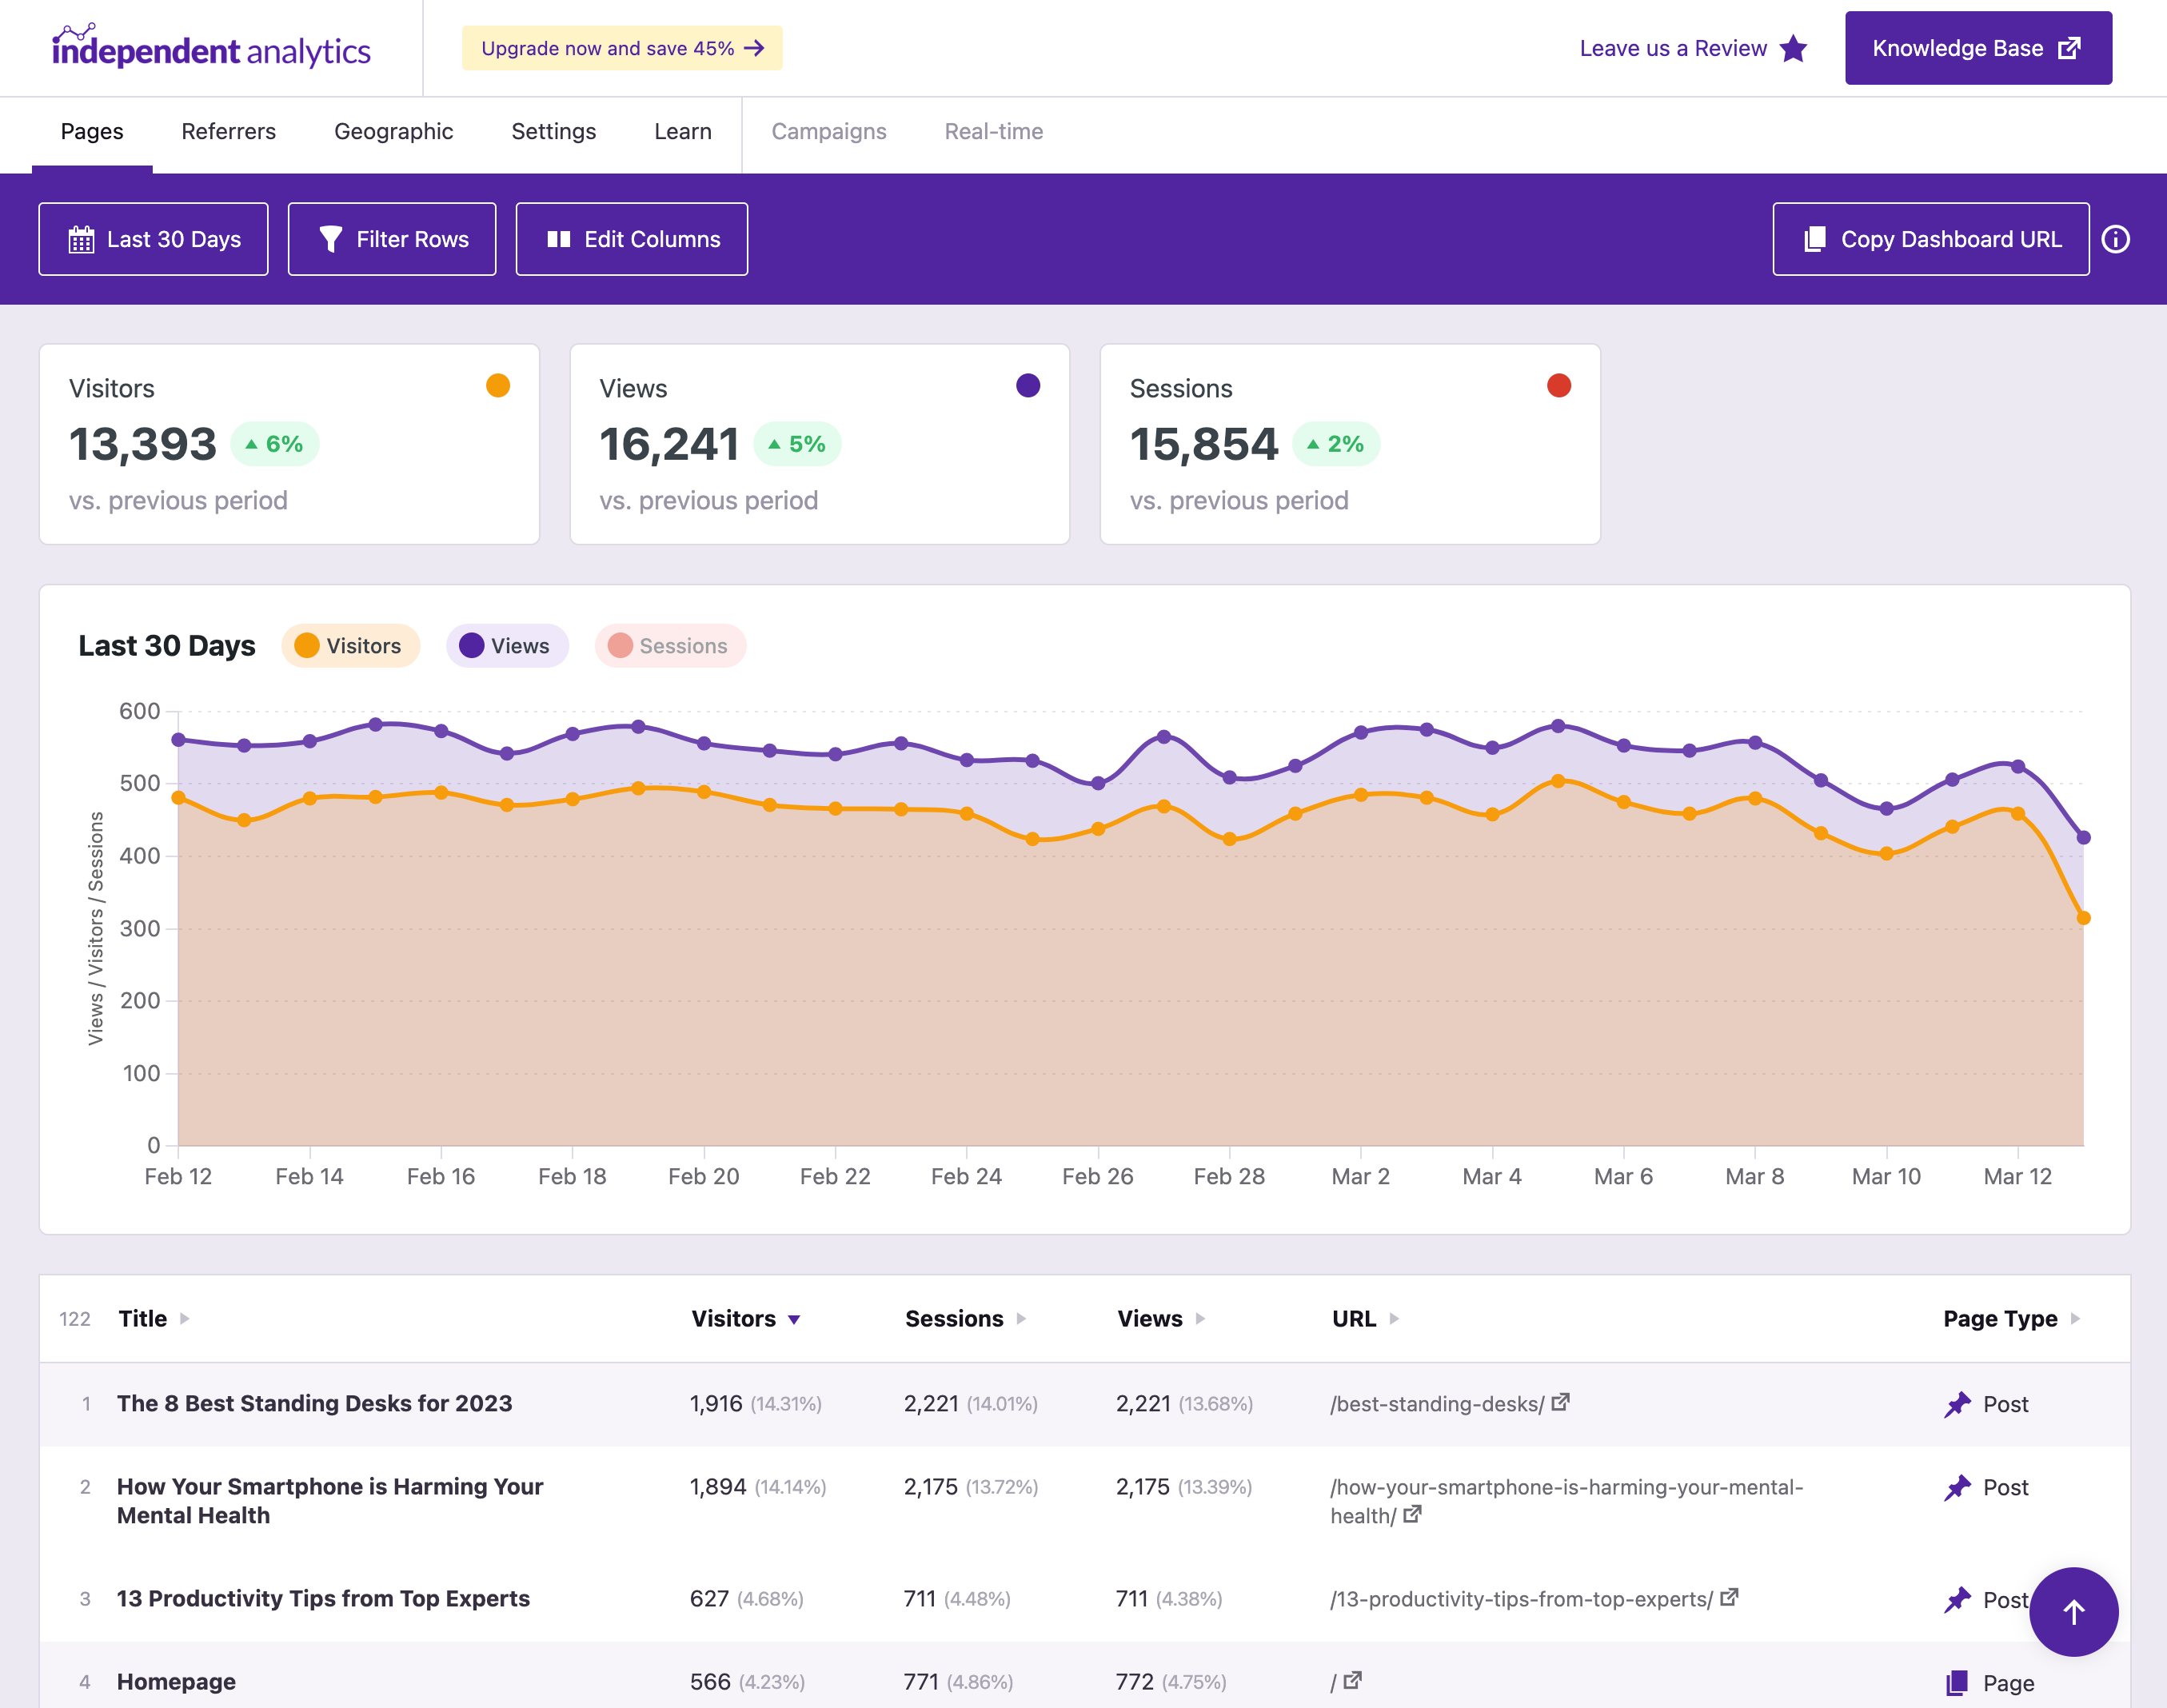
You'll also notice that the Quick Stats have a lighter font and new icon, but more importantly, the filtered values now show inside the same boxes rather than getting their own.
We found this to be a more visually pleasing and readable layout.
What you wouldn't guess from this update is that 90% of the changes didn't make it into the changelog. Our first crack at adding session duration exposed a weakness in our query design and slowed down the dashboard massively. There was an overhaul of this system, and after the refactor, we were able to include the new duration metrics without affecting performance negatively.
What's next?
Most of the top-voted requests here are for metrics, so we're going to keep our foot on the gas and include a handful more metrics before turning our attention to anything else.
Next up, we'll be adding Bounce Rate and Pages Per Session, so you can expect those in your dashboard soon!
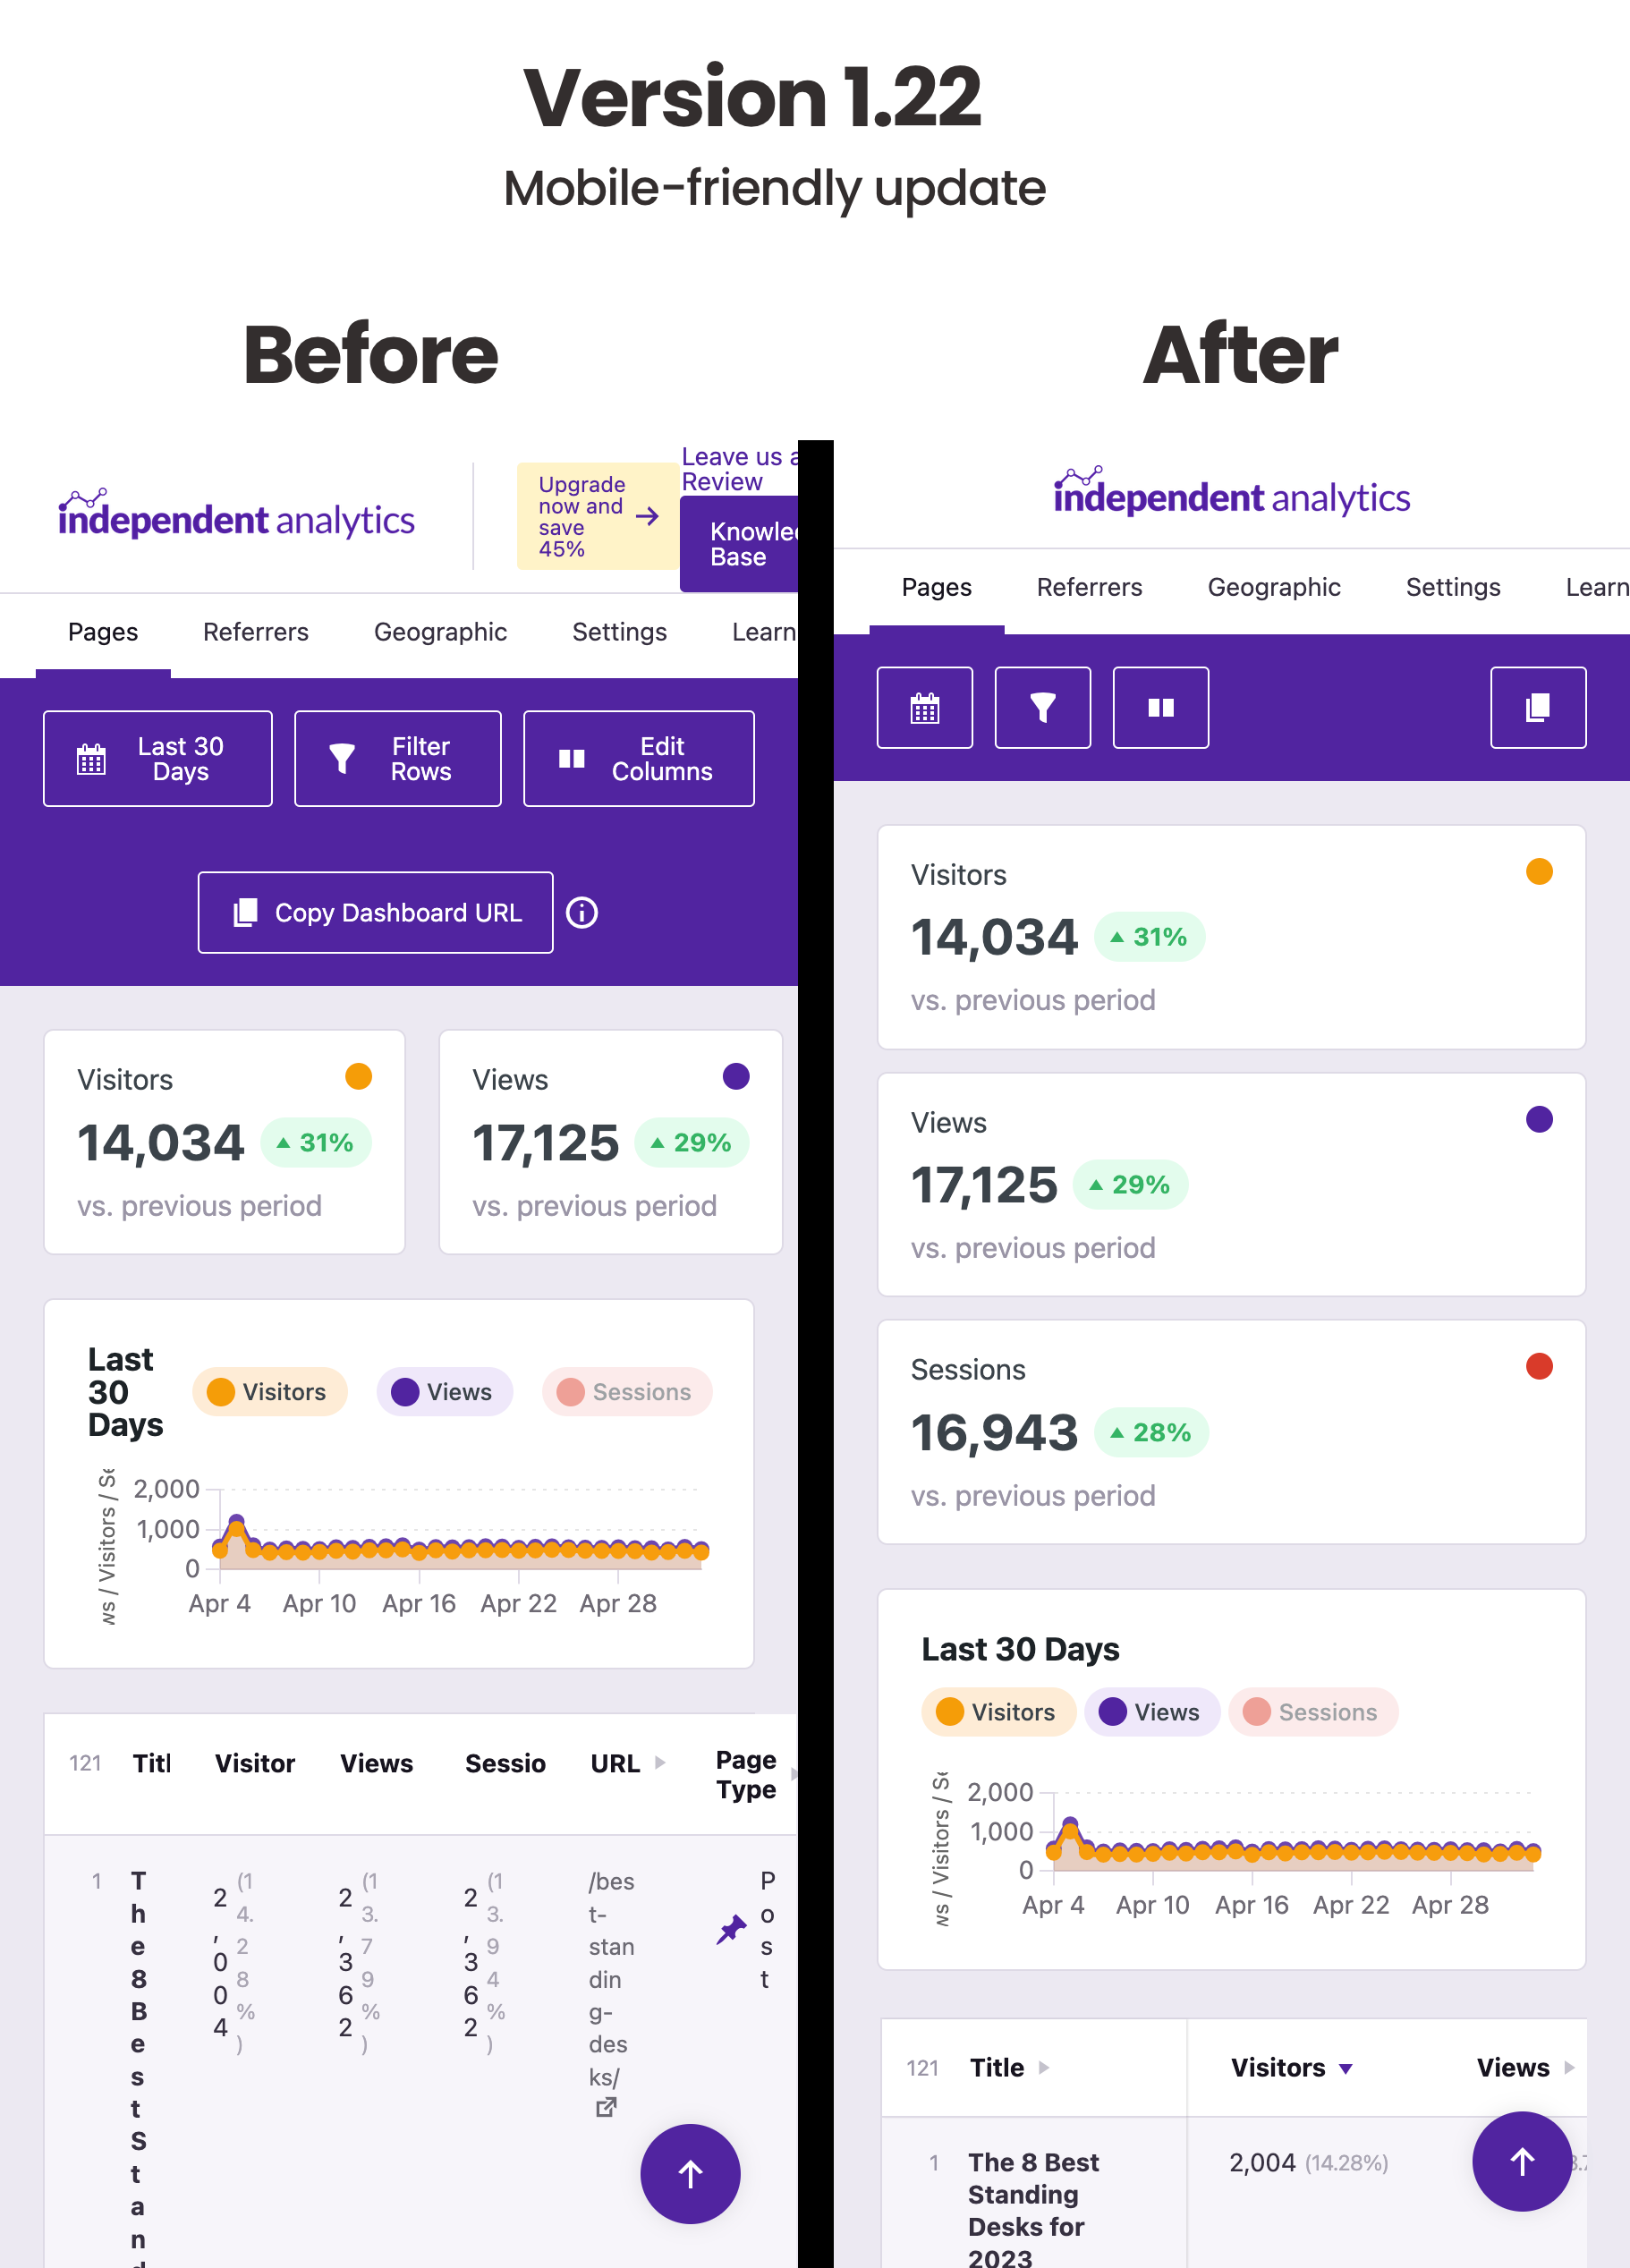
The table was completely unusable before but is now readable and easy to navigate. There's vertical scrolling to scan through your rows and horizontal scrolling to navigate through the columns.
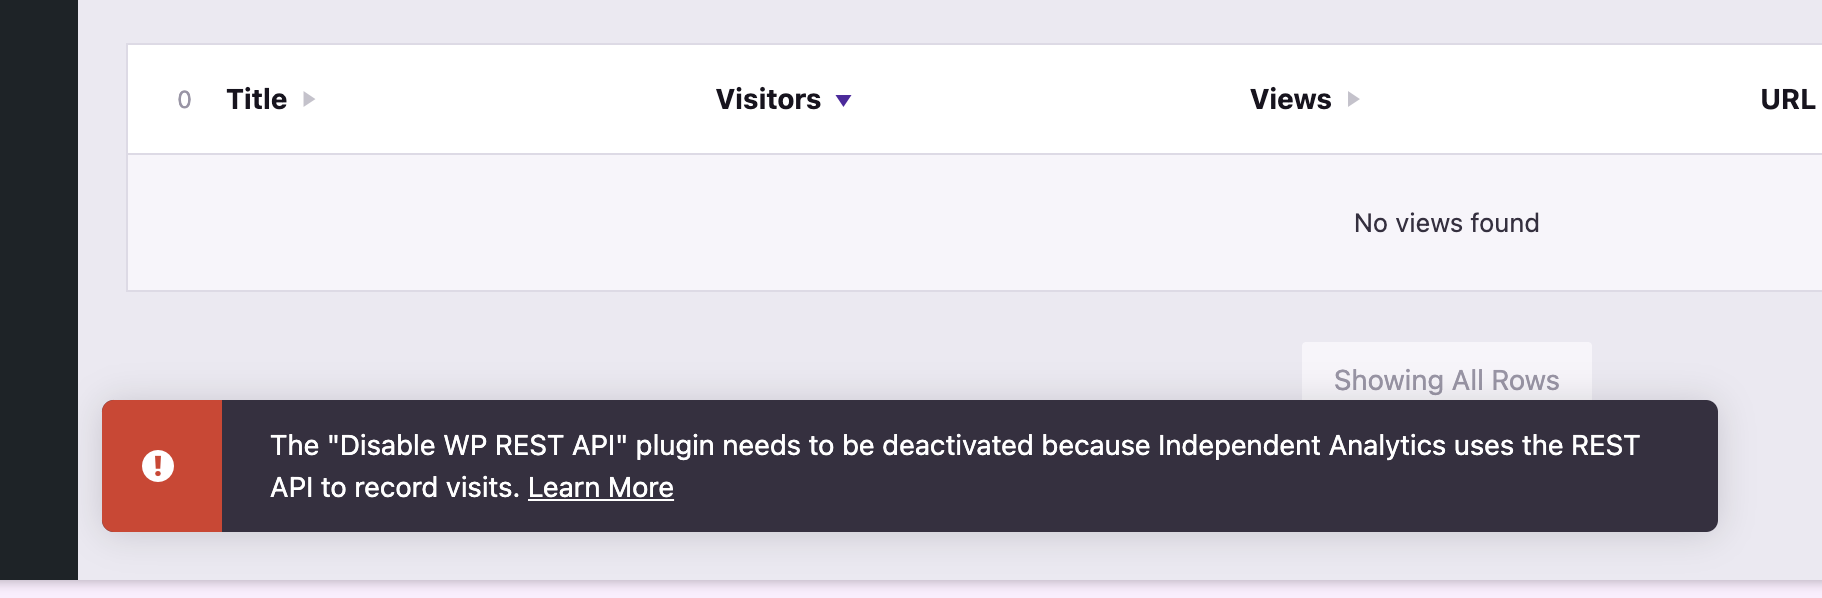
The mobile design was the biggest feature of this update, but we also fixed numerous bugs, the most prominent of which was the REST API notice.
We have a method of testing whether the REST API is enabled or not, but as it turns out, this is much more complex than we anticipated. We inadvertently ended up displaying these notices on sites due to false positives.
In v1.22, we stripped out our automated checks entirely so that warning only displays if you're using a plugin that is definitely blocking the REST API, like Disable WP REST API.
There's one more aspect of version 1.22 that we need to discuss...
Session duration coming soon!
We really wanted to include the Average Session Duration metric in this release, but we couldn't quite get there. We have the functionality working, but the queries were taking too long and making the dashboard too slow.
We're in the midst of optimizing these queries now, which will allow us to ship this feature without slowing down the dashboard. We expect to include the Average Session Duration metric in our next update, v1.23.
Today's update brings massive performance improvements to the Referrers menu.
If you have a small website, then you may not have experienced any issues, but for sites with 1,000+ sites in the Referrers menu, you likely saw load times as slow as 20 seconds.
As much as we love adding new features, these load times were too cumbersome and needed to be addressed ASAP. With the new improvements in version 1.21, even sites with thousands of referrers should see the menu load completely in 3-5 seconds.
In version 1.20, we've done a lot of housekeeping. There were many small bug fixes and code improvements that will make IA even more reliable and hardy moving forward.
While critical, we know these kinds of updates are boring, so we also tossed in a fun new feature 🙂
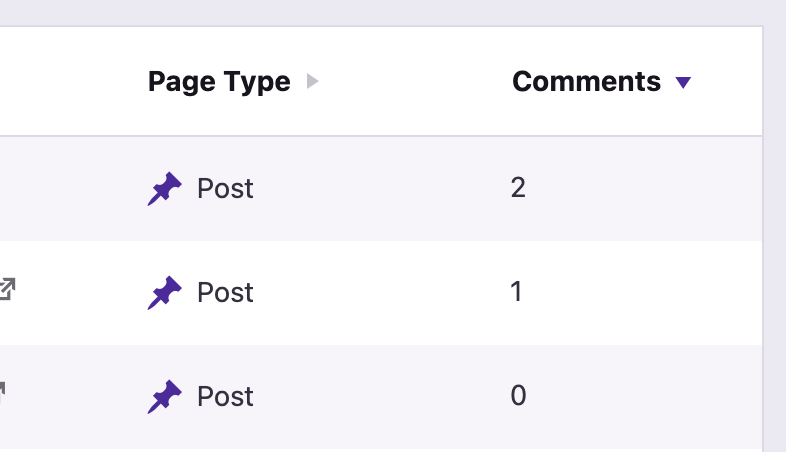
This column shows how many comments each post/page has received in the given time period.
While you can find total comments in the Posts menu, we thought it'd be cool to see the number of comments in a given period. If any post is getting a lot of engagement via the comments, it could be a good idea to feature it on your site to boost engagement even further.
Like other columns, you can also sort and filter by the number of comments.
Our next update will include a handful of bug fixes and code-hardening improvements. We wanted to toss in something fun as well, so we're adding a new data column that will show you how many comments each post/page has. This will give you an easy way to find the articles on your site with the most comments, which could be a good source of inspiration for future content.
Since this update is relatively small, it should be out fairly soon. After that, we will be making some major performance improvements. For large sites, the Referrers menu can load quite slowly, and we aim to get the load time under two seconds for everyone, regardless of how many thousands of referrers there are.
Sessions are reported in the stats, chart, and in a new data table column. This means you can also sort and filter pages/referrers/geolocations by sessions.
You will see Sessions data immediately because we started tracking them internally in version 1.17. For that reason, you may see Sessions recorded from the past month but not any further back than when you updated to 1.17.
What is a session?
A session is a single experience someone has with your website. For instance, if someone visited your blog, read five posts, and left, this would be counted as 1 visitor, 5 views, and 1 session. If they return the next day, view one page, and leave, the new totals would be 1 visitor, 6 views, and 2 sessions.
Figuring out when a session has ended is difficult, but we've decided to use a 30-minute cut-off, which is what Google Analytics does too. In other words, if someone does not view a new page within 30 minutes, the session is concluded, and any future page views will be counted toward a new session.
Coming up next
Now that sessions are fully implemented, we are getting ready to add more metrics, like Pages per Session and Average Session Duration.
We also have a number of performance updates we'd like to include. For large sites, the dashboard can load quite slowly, especially the Geographic menu. Additionally, there are some duplicate data in the database that we can clean up, and this may greatly reduce the amount of space that Independent Analytics takes up in the database.
These metrics make it even easier to find your most profitable marketing tactics.
Before, you may have sorted your referrers by Net Sales to see which ones have generated the most revenue.
Now, you can do things like sort by the conversion rate, which will uncover referrers that may not have created many sales but have converted very effectively. These are the best channels to double down on and try to grow further.
WooCommerce metrics in the Quick Stats and Chart (PRO)
In our first iteration of the WC integration, we only added columns. Now, you can see your Orders and Net Sales in the Quick Stats of every page as well as in the charts.
Other improvements to Independent Analytics include:
A fix for the view counter shortcode, which was always showing "0" views on archive pages
Updates to the Danish translation
Integration with the Coming Soon & Maintenance Mode plugin by Colorlib
Corrected sorting for the Top Ten lists in the PDF report (PRO)
What's next?
The next update is going to add a new metric called "sessions." You may be familiar with sessions already, but here's the idea...
If someone visits your site and views five pages, Independent Analytics would record 1 visitor and 5 views. With the next update, this would also record 1 session. Likewise, if that same visitor returned the next day and viewed only 1 page before leaving, your analytics would show a total of 1 visitor, 6 views, and 2 sessions.
In other words, sessions group views that occur together, giving you a better reading of how often someone arrives on your site and explores it. This metric will also open up the door for session-based metrics, such as pages per session and average session duration.
We know that average visit time and pages per session are two of the most highly-requested features, and we will implement them soon!
When adding the WooCommerce integration in version 1.17, we realized that major structural changes to the database were needed to attribute sales to the correct referrers/locations/campaigns. This took much longer than anticipated and slowed us down quite a bit. However, it set the groundwork for new metrics.
If you're running version 1.17 on your sites, you're actually recording sessions already. We aren't displaying this data yet, but behind the scenes, every visitor and their pageviews are being saved together as unique sessions.
When we add the Sessions metric to the dashboard, you will already have a few weeks of this data recorded. Furthermore, the implementation of session tracking enables us to calculate how long visitors spend on each page, how long their sessions last, and how many pages they visit per session. It also opens up the possibility for other exciting features, like a landing pages report. We hope to add these metrics in the next couple of updates.
Thanks for following along with us on this journey! If you want to get notifications for these types of updates, you can follow us on Facebook or Twitter where we share these posts and more.
v1.17 - WooCommerce Integration, Email Reports, and Ignoring Users by Role
This release is huge!
It took much longer than we expected, but we're thrilled to finally go live with version 1.17. Here's what it includes:
WooCommerce integration (PRO)
For Pro users, we have a brand new integration with WooCommerce. This adds new columns that display data like your orders, refunds, and net sales to the Referrers, Geographic, and Campaign reports.
This will make it easy to compare the performance of various marketing channels and campaigns.
Another exciting update for Independent Analytics Pro is the addition of email reports. The monthly email report can be configured rapidly from the Settings menu and will send out a neat PDF report like this:
One of the best parts of Independent Analytics is its native integration with WordPress. It allows us to ship features that are way easier to use than competing analytics products like Google Analytics.
With the new user role blocking feature, you can ignore views from any user role in just a few clicks.
For membership sites, this will be extremely useful because you can simultaneously track logged-in Subscribers while ignoring traffic from the Admins and Editors.
Due to better attribution, you will see your Direct views decrease in the Referrers report while views to other traffic sources will increase. Up until now, the number of views attributed to the Direct referrer has been inflated.
New metrics coming soon!
The WooCommerce integration required a lot more back-end changes than we anticipated, which is why it took us over a month to get this release out. Well, that along with the (welcome) disruption caused by year-end holidays ;)
As part of this release, we had to create session tracking to attribute WC sales to the proper referrer. You will not see Sessions appear in the dashboard just yet, but most of the work is already complete. This has opened the door for other highly anticipated metrics, like Average Time on Site and Pages Per Visit. We hope to have these metrics added to the dashboard soon, as they should be relatively easy to implement now that session tracking has been added.
It can also detect if the REST API is currently blocked, which prevents it from recording any data. This has been an issue for quite a few users since launch. The new notification will make it clear there is an issue right away, and it has built-in detection for the most popular plugins that block REST API requests.
We also made the decision to sort the data table by Visitors instead of Views and have given the Visitors metric more visual priority in the interface. This seemed like a more logical way to look at the data i.e. I want to see how many people visited my site and then see how many pages they viewed, not the other way around.
Views Growth & Visitors Growth hidden by default
Lastly, we were really excited to include Views Growth and Visitors Growth in version 1.15, but we found that they cluttered the table. We've decided to hide these columns by default as they aren't necessary for daily observation. You can display them again easily with the Edit Columns button.
What's next?
Thanks for keeping up with our development progress!
If you've been following the roadmap, then you've already seen that scheduled email reports and WooCommerce analytics are on the way. We had to make a pit stop at version 1.16 to release these bug fixes and enhancements, but in version 1.17, we will be completely focused on those two features.
v1.15 - Real-time Analytics and Views/Visitors Growth
This update brings the second major feature to Independent Analytics Pro and valuable new insights for all users via the Views/Visitors Growth columns.
Real-time analytics
We're thrilled to release Real-time analytics, which has been requested quite a lot since the launch of Independent Analytics. This dashboard shows you how many people are on your site, what pages they're viewing, what sites referred them to you, and what countries they came from.
You can see a glimpse of the progress bar at the bottom of the page, which lets you know when the date is going to refresh. We settled on updating the dashboard every ten seconds, as this gives you enough time to read the data without it changing too rapidly (or taking too many server resources).
You can get the Real-time analytics dashboard now with a copy of Independent Analytics Pro, which is still on sale for 60% off until the end of Cyber Monday. After that, we'll be permanently reducing this discount.
The Real-time Analytics dashboard was definitely the "star of the show," but there's another awesome feature that everyone's getting.
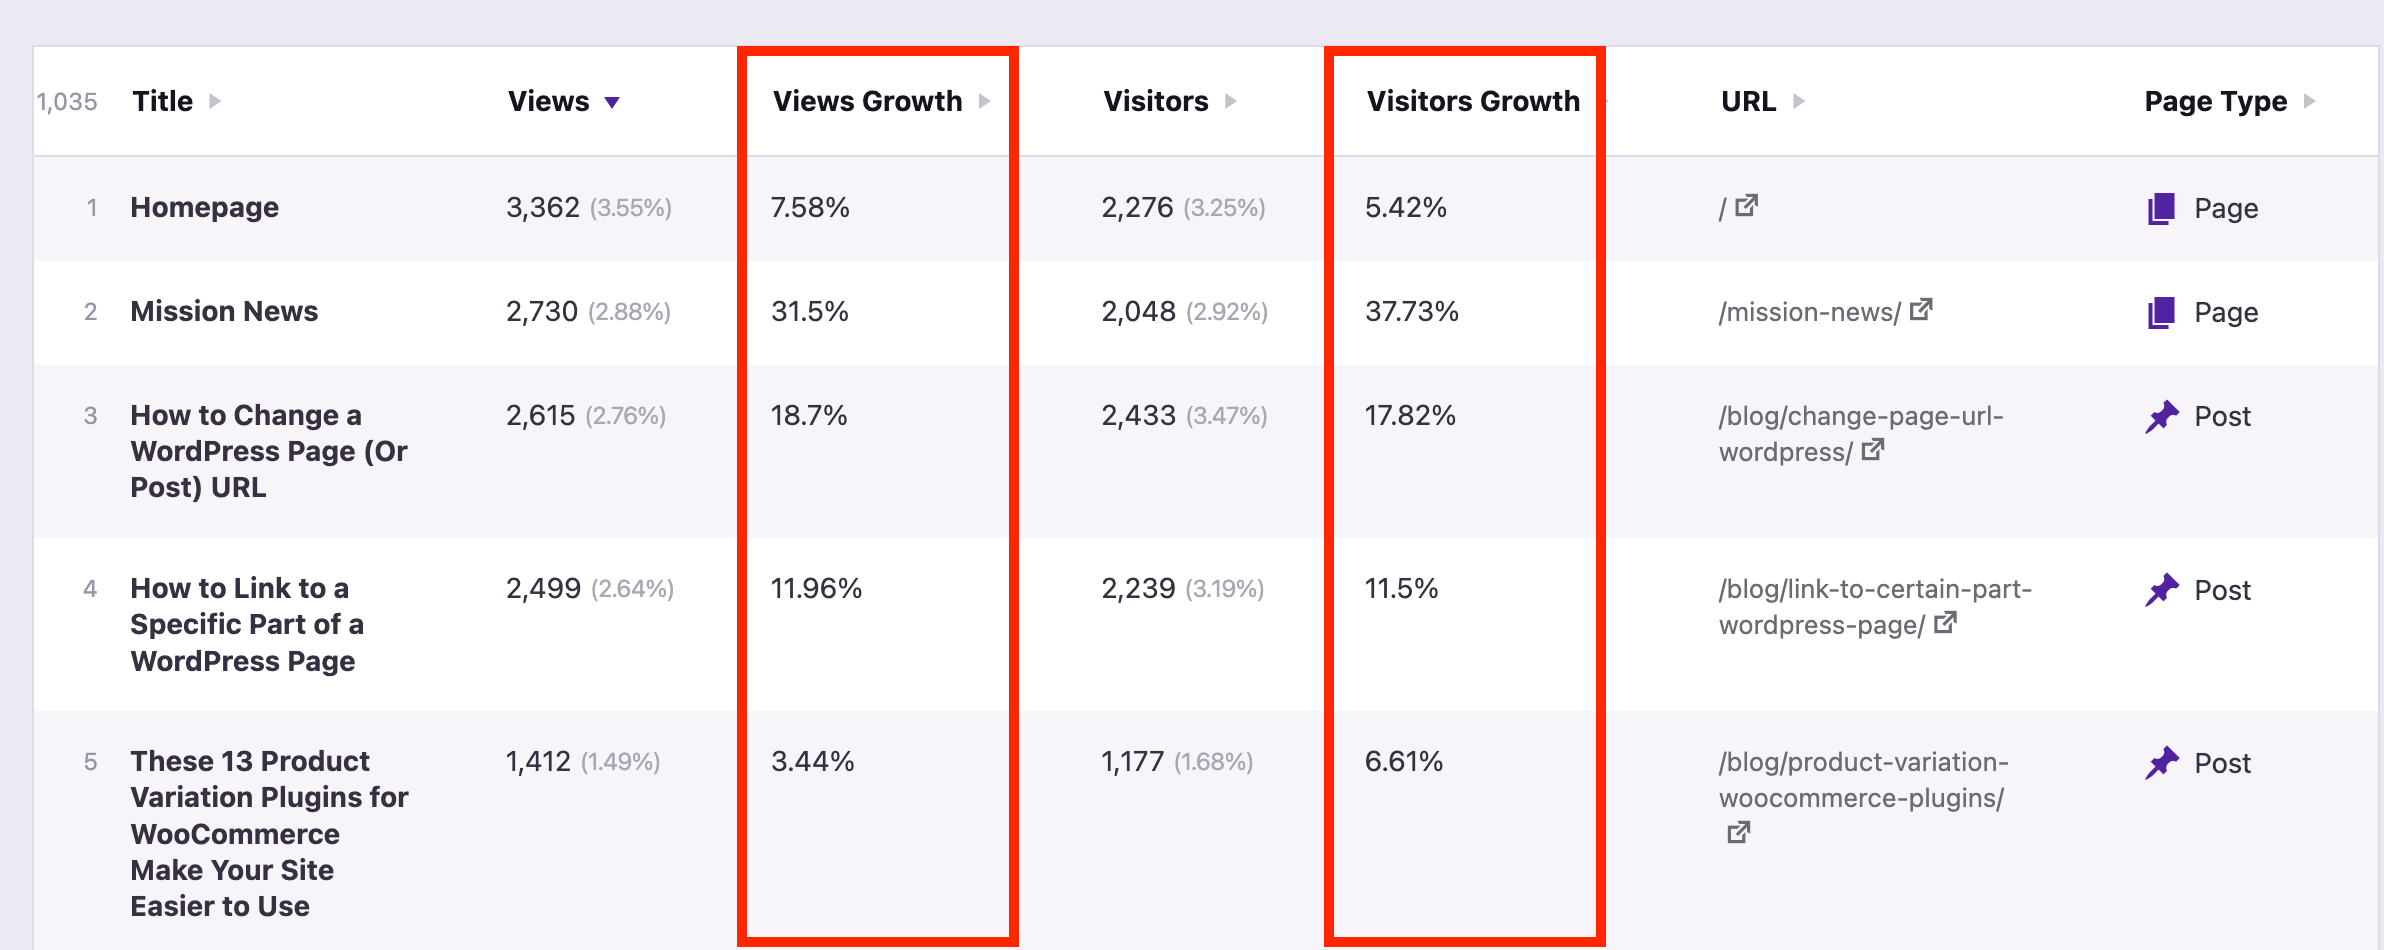
Views Growth & Visitors Growth
Once you update to version 1.15, you'll find two new columns in the dashboard showing you how much more (or less) popular each page has become:
This lets you rapidly uncover your growing and "slowing" pages. You can sort by the highest/lowest growth in a single click, and these columns are available in the Referrers, Geographic, and Campaigns dashboards too.
Other fixes and updates
Besides those two changes, we've also added the ability to white-label the analytics dashboard for non-admins and included support for blocking IP addresses with wildcards.
There's also been a bug affecting some users' ability to view the data table, and that's been sorted out.
Overall, this has been a pretty big release for us. In our next update, we're looking to improve the dashboard performance for bigger sites and add scheduled email reports.
There are SO many other features we can't wait to implement, from WooCommerce sales data to the Time on Page metric. Know that we're hard at work, bringing as many of these tools to our users as fast as we can.
v1.14 - Row percentages, Dutch translation, and a sorting fix
Today's update is a small one.
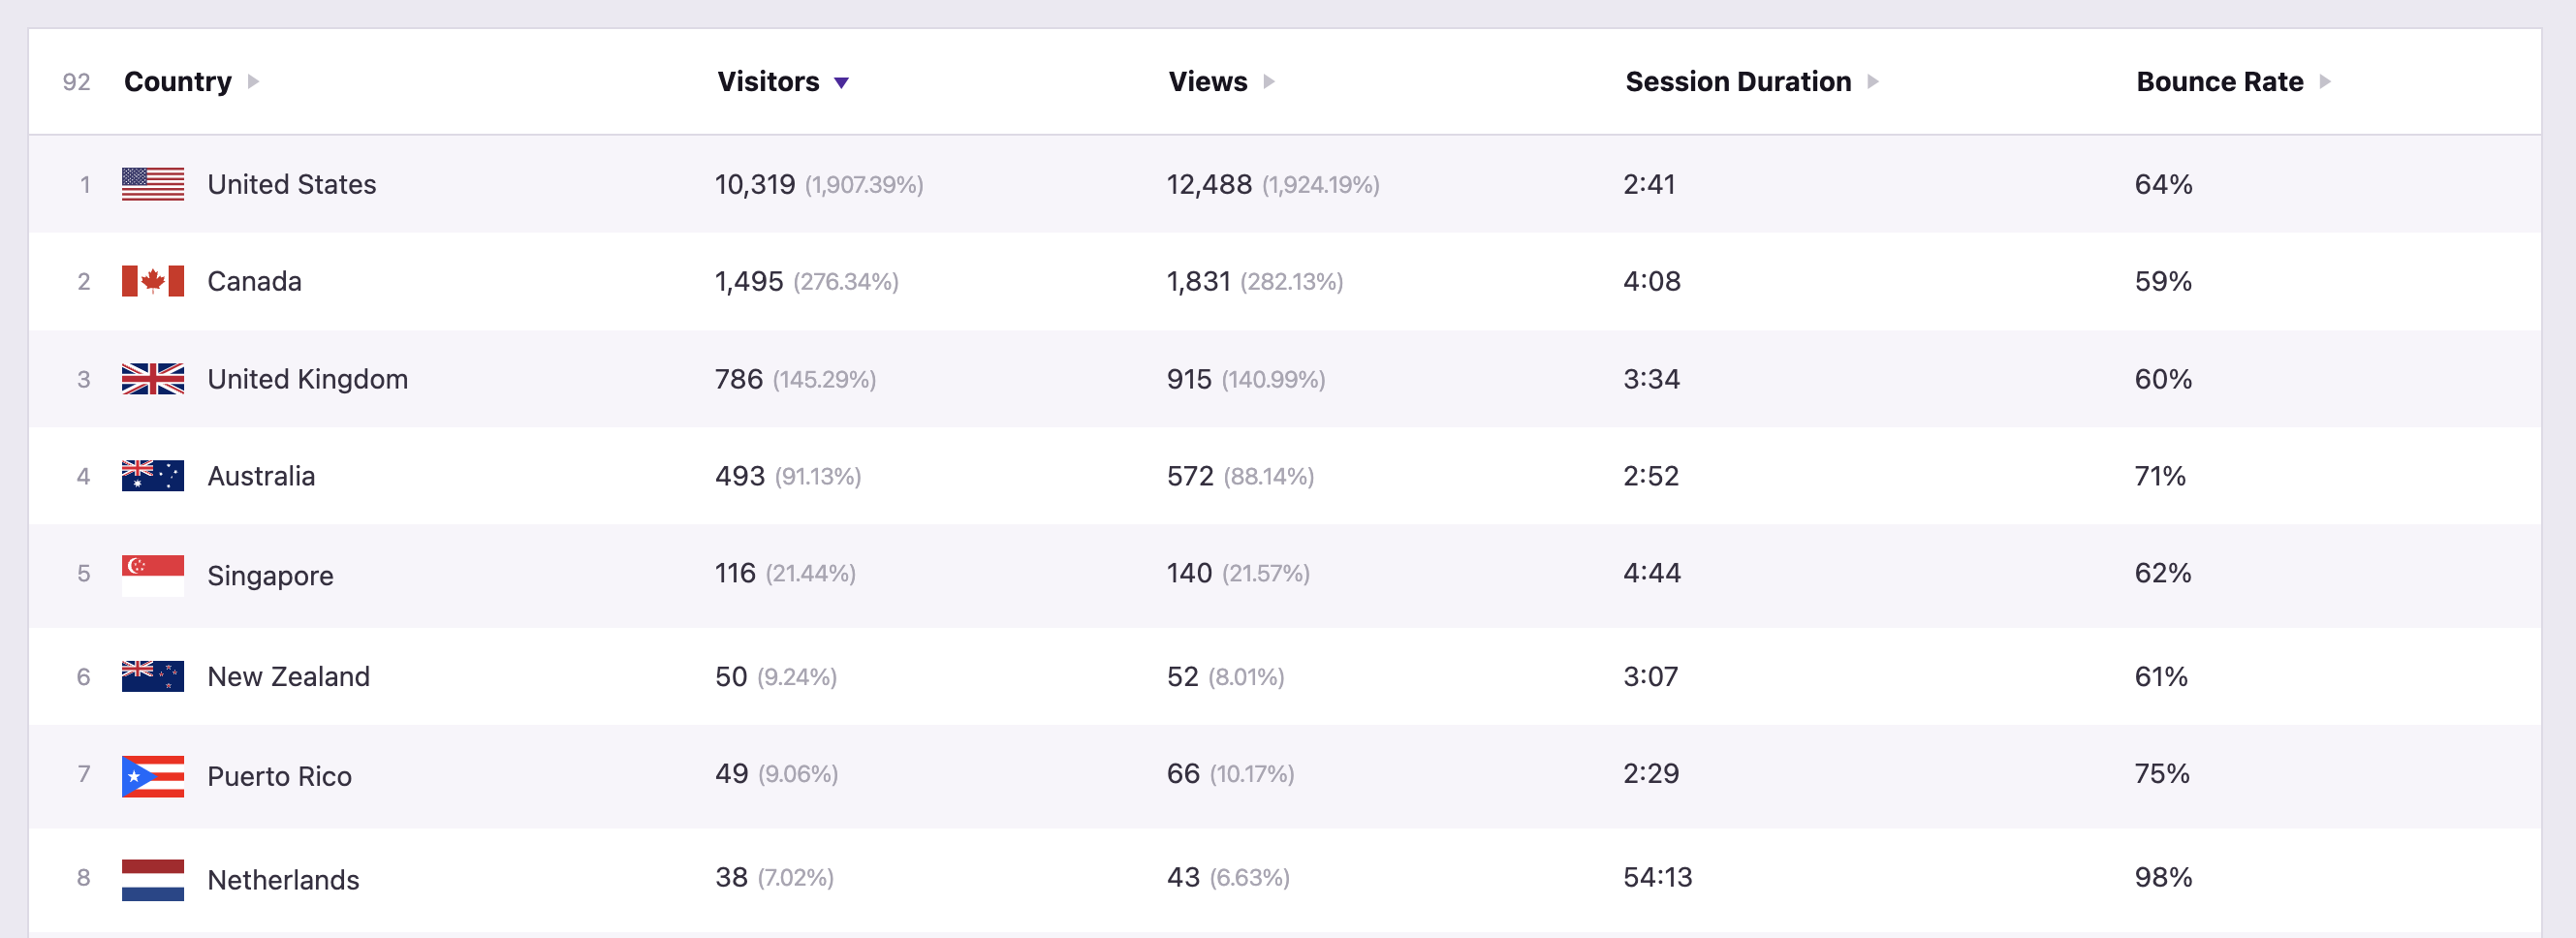
First off, we've added percentages next to the view and visitor count for each row. This means you can look at a page and see it's responsible for 15% of your total views or see that Google sends you 40% of your traffic.
We also added a Dutch translation - thank you to Ivan!
And lastly, there was an error for some environments that could cause the sorting to be incorrect when the dashboard was first loaded. That is now fixed.
v1.13 - Report URLs, IP Blocking, and User Role Permissions
It's been a month since our last update, but this one's a doozy. In version 1.13, we've added a few highly requested features.
Report URLs
You may have noticed that if you refresh the page, you lose your settings, such as the date range and filters. This is now a thing of the past.
The URL in your browser now updates as you make changes, so you can refresh the page and keep your current settings, and you can save URLs for later.
Basically, you can customize the dashboard until you're viewing something highly specific, like Blog posts with 100 or more views, and then copy that URL and save it somewhere, like Apple Notes or Notion. Then you can simply visit that URL again to pull up the same report without needing to set the filters again.
If you're the only one working on your site, it's pretty easy to make sure you're always logged in, and then Independent Analytics won't record your visits.
But if you have a team, and many of them don't have logins, their activity can skew your data. This is why it's important to block these IP addresses, and now you can via the new IP blocking section added to the Settings menu
The last major feature of this update is the ability to grant permission to non-admins to view the analytics.
Up until now, only admins on the site could view the analytics, but there are many good reasons why you might want editors or other user roles to see this data too.
With the new User permission section in the Settings menu, it's simple to give other user roles analytics access.
You'll probably notice that when you navigate between menus, the date no longer changes. We've found that this is the more user-friendly behavior and makes it easier to do things like find today's top pages and then today's top referrers and locations.
What's next?
In version 1.14, we hope to add some exciting new features for our Independent Analytics Pro users. Speaking of which, the 60% discount is still available for annual and lifetime subscriptions.
If you want a say in what we build next, head over to the Feature Request page to submit new ideas and upvote your favorites.


 Powered by FeedBear