v1.25 - Geodata grouped by country + Views Per Session metric
The version 1.25 update brings two highly-requested features to IA: country data in the Geographic report and a new Views Per Session metric.
Group by country
When you visit the Geographic menu, you'll notice two changes. First, the data table is now grouped by country instead of city:
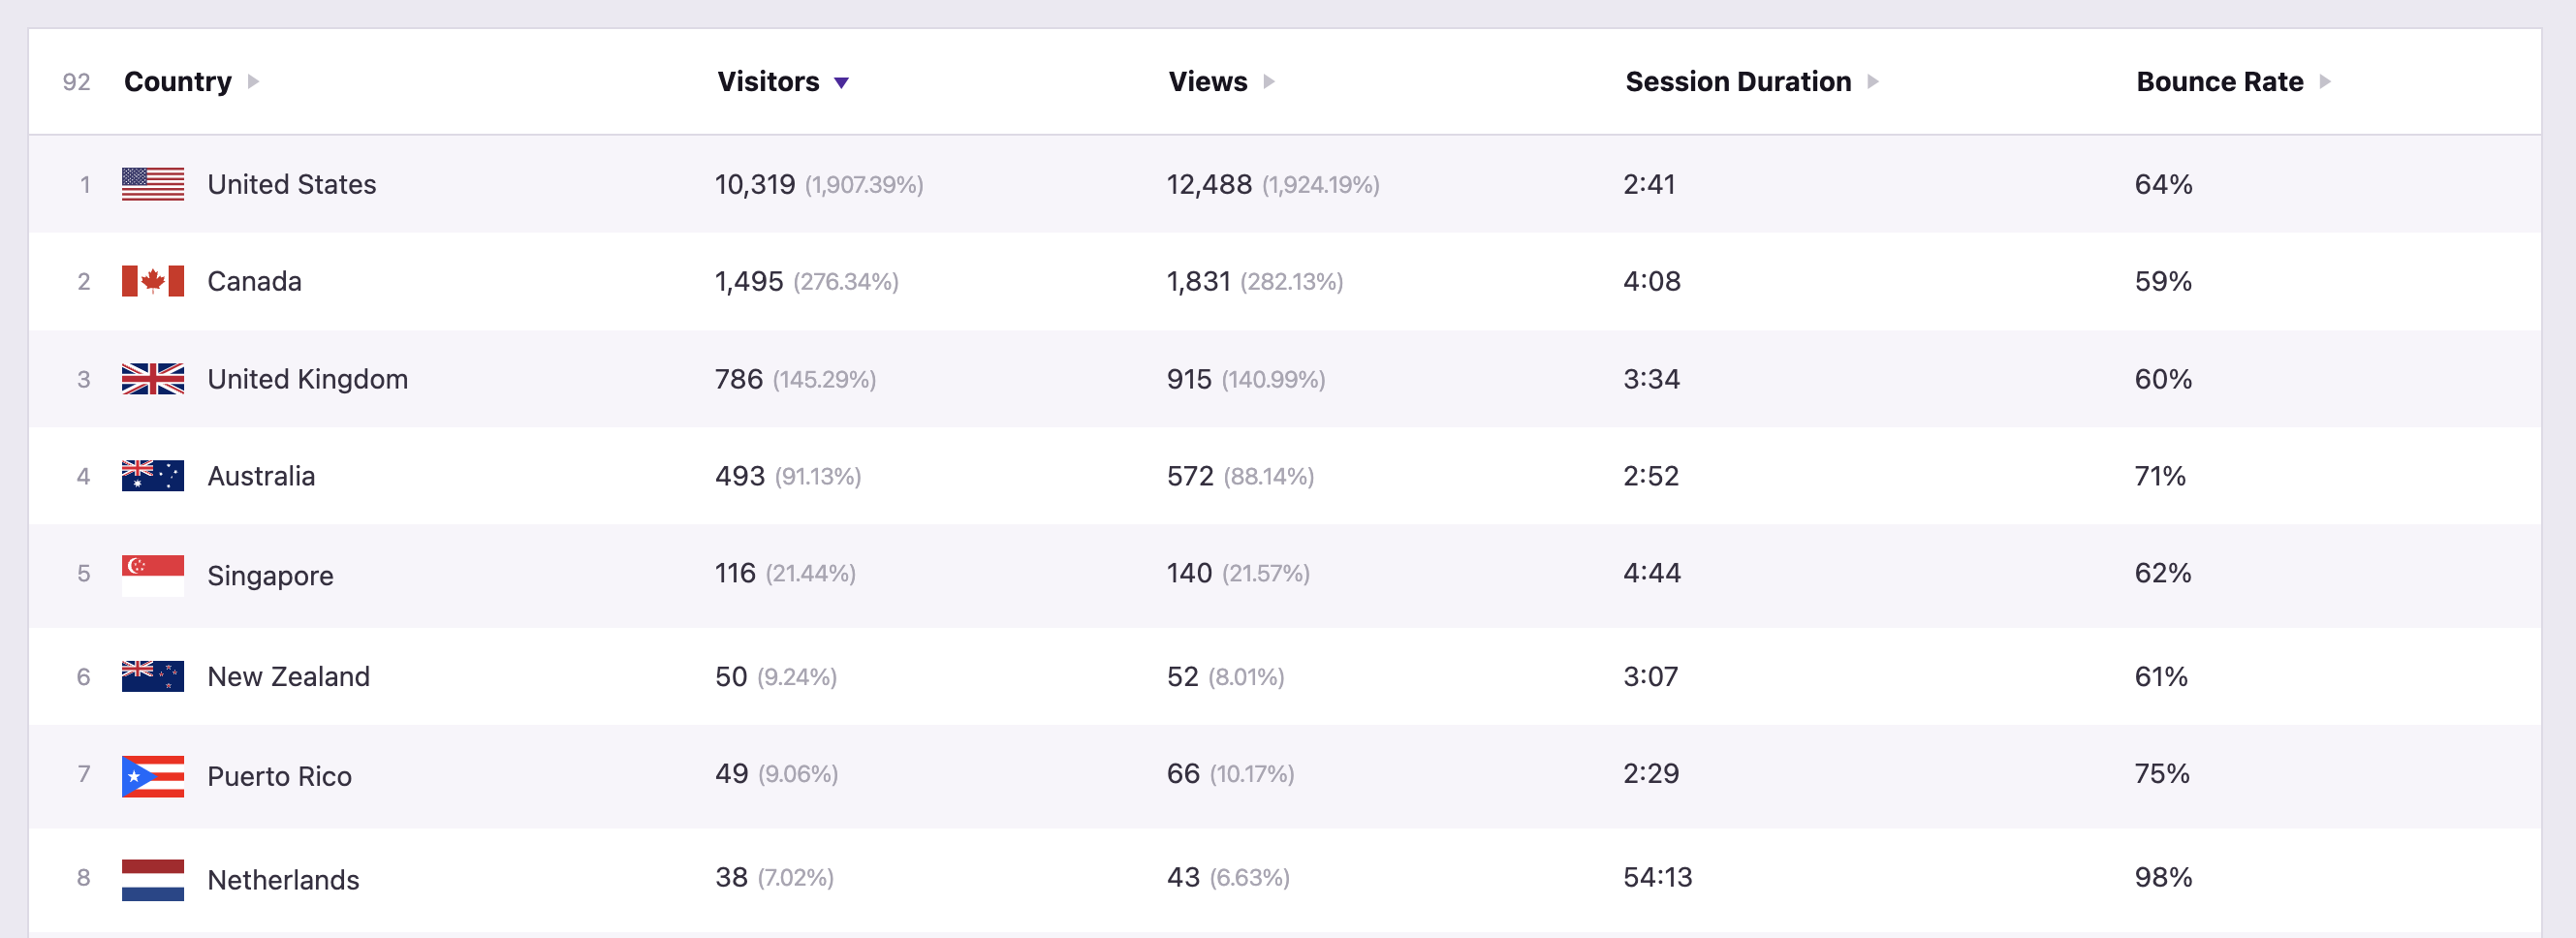
For most people, this will make geographical analysis much easier. However, if you'd like to see city data, that brings us to the second change...
In the toolbar, there's a new button that will let you change how the data is grouped, so you can switch to city grouping instead:
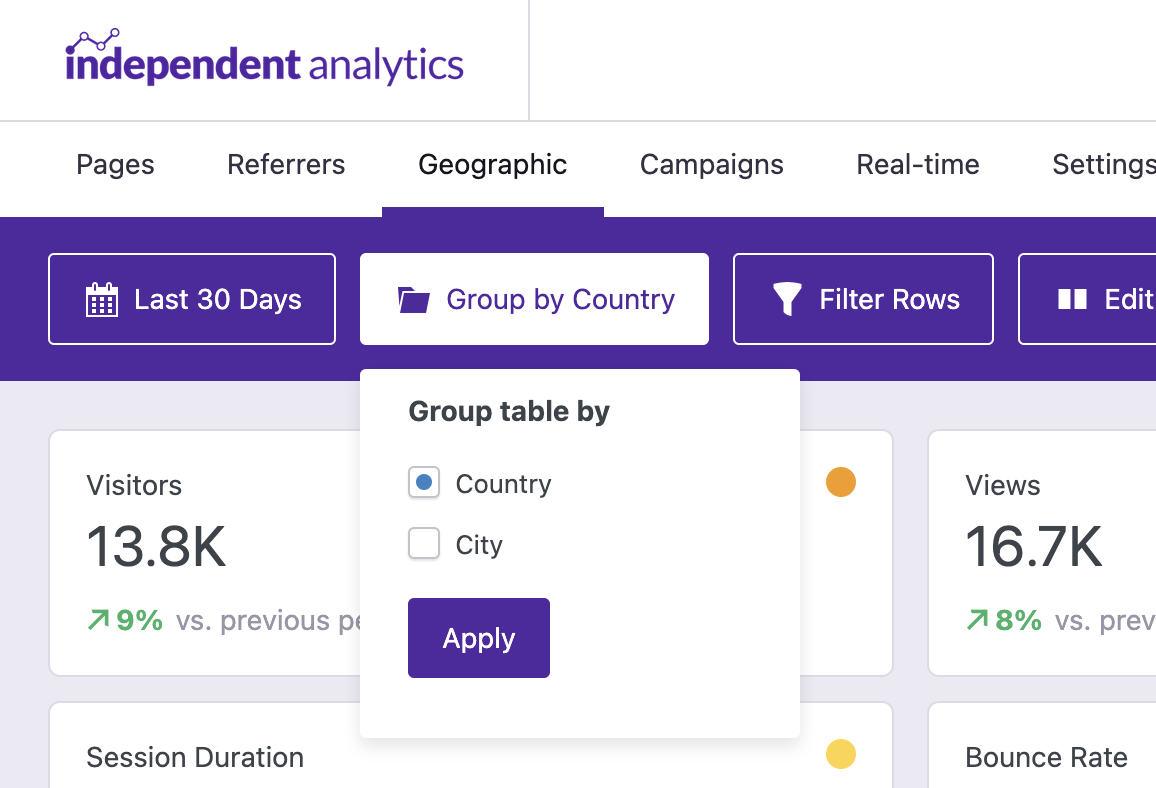
This way, you can toggle back and forth to get the level of precision you need.
Views per session
When you visit the dashboard, you'll notice the shiny new Views Per Session metric in the Quick Stats:
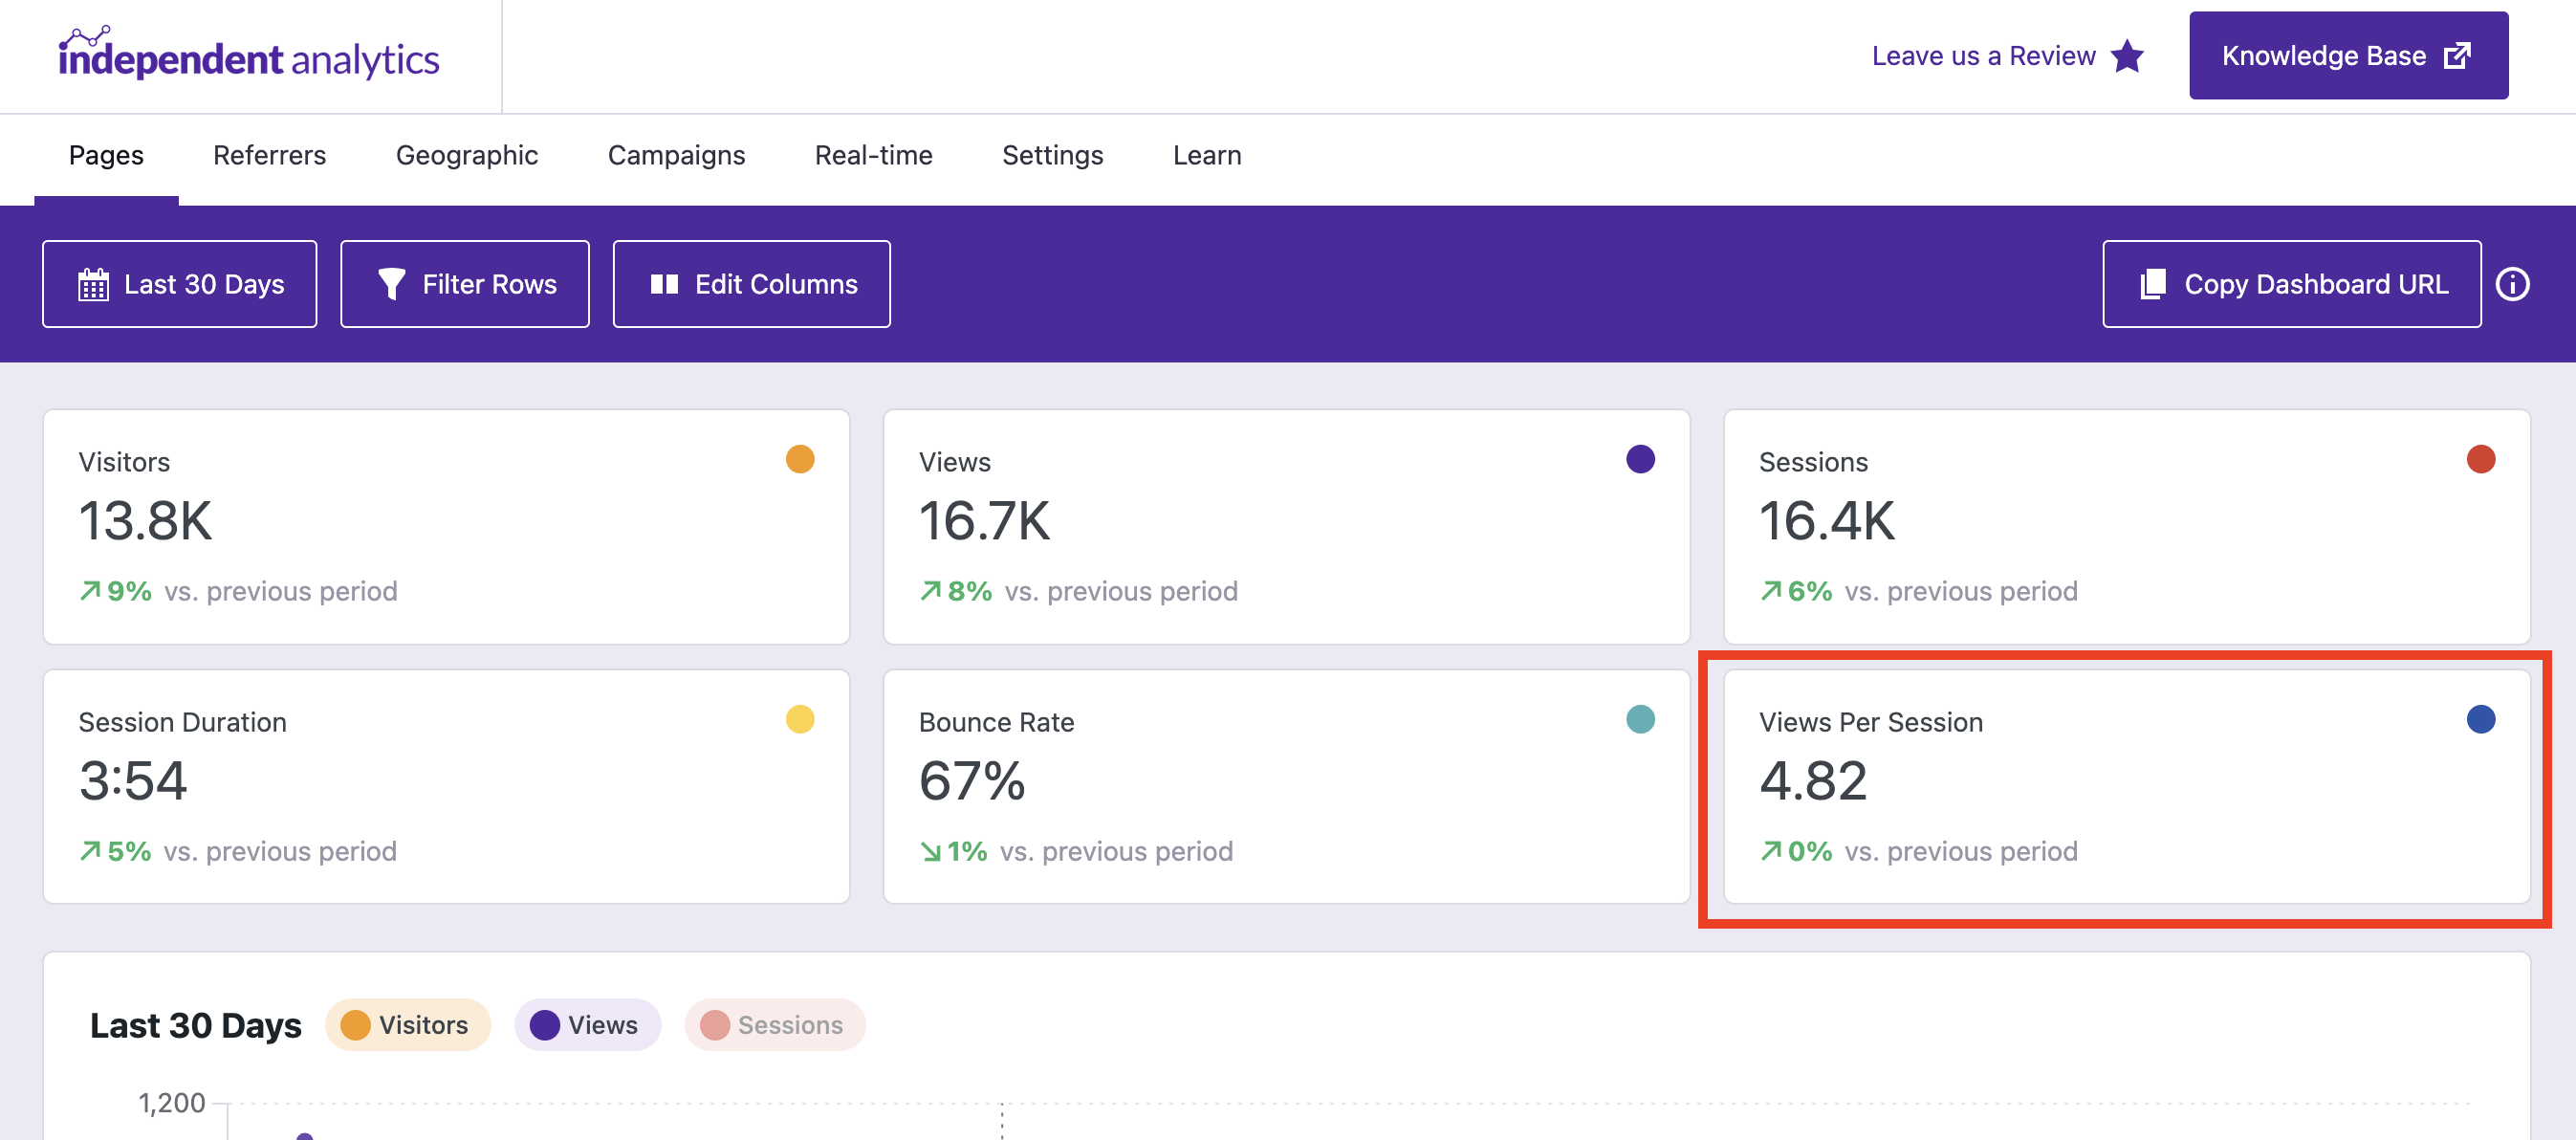
This lets you know how many pages visitors view (on average) each time they visit your site. We have more info about this metric here if you want to get into the nitty-gritty details.
Those two changes dominated this release, so not much else changed besides a fix for a rare error that interrupted the installation on some sites.
What's next?
In the next release, we are going to update the chart so that you can see hourly data. As it is now, the chart is pretty useless when looking at data for only today or yesterday, and we'd like to change that.
For our Pro users, we will also be converting the email report from an attached PDF to an HTML email. We found that PDFs are too unwieldy for us to design the way we want, and it should also be easier for everyone to simply look at the email for their stats instead of downloading a PDF, which is especially unfriendly on mobile.