Version 2.0 - Saved Reports + New UI!
We've been looking forward to this feature for over a year!
Given how big this change is, we're naming this Version 2.0 of Independent Analytics, and it fundamentally changes how you'll use your analytics.
Given how big this change is, we're naming this Version 2.0 of Independent Analytics, and it fundamentally changes how you'll use your analytics.
Introducing Saved Reports
When you update to 2.0, you'll notice the change in the interface immediately:
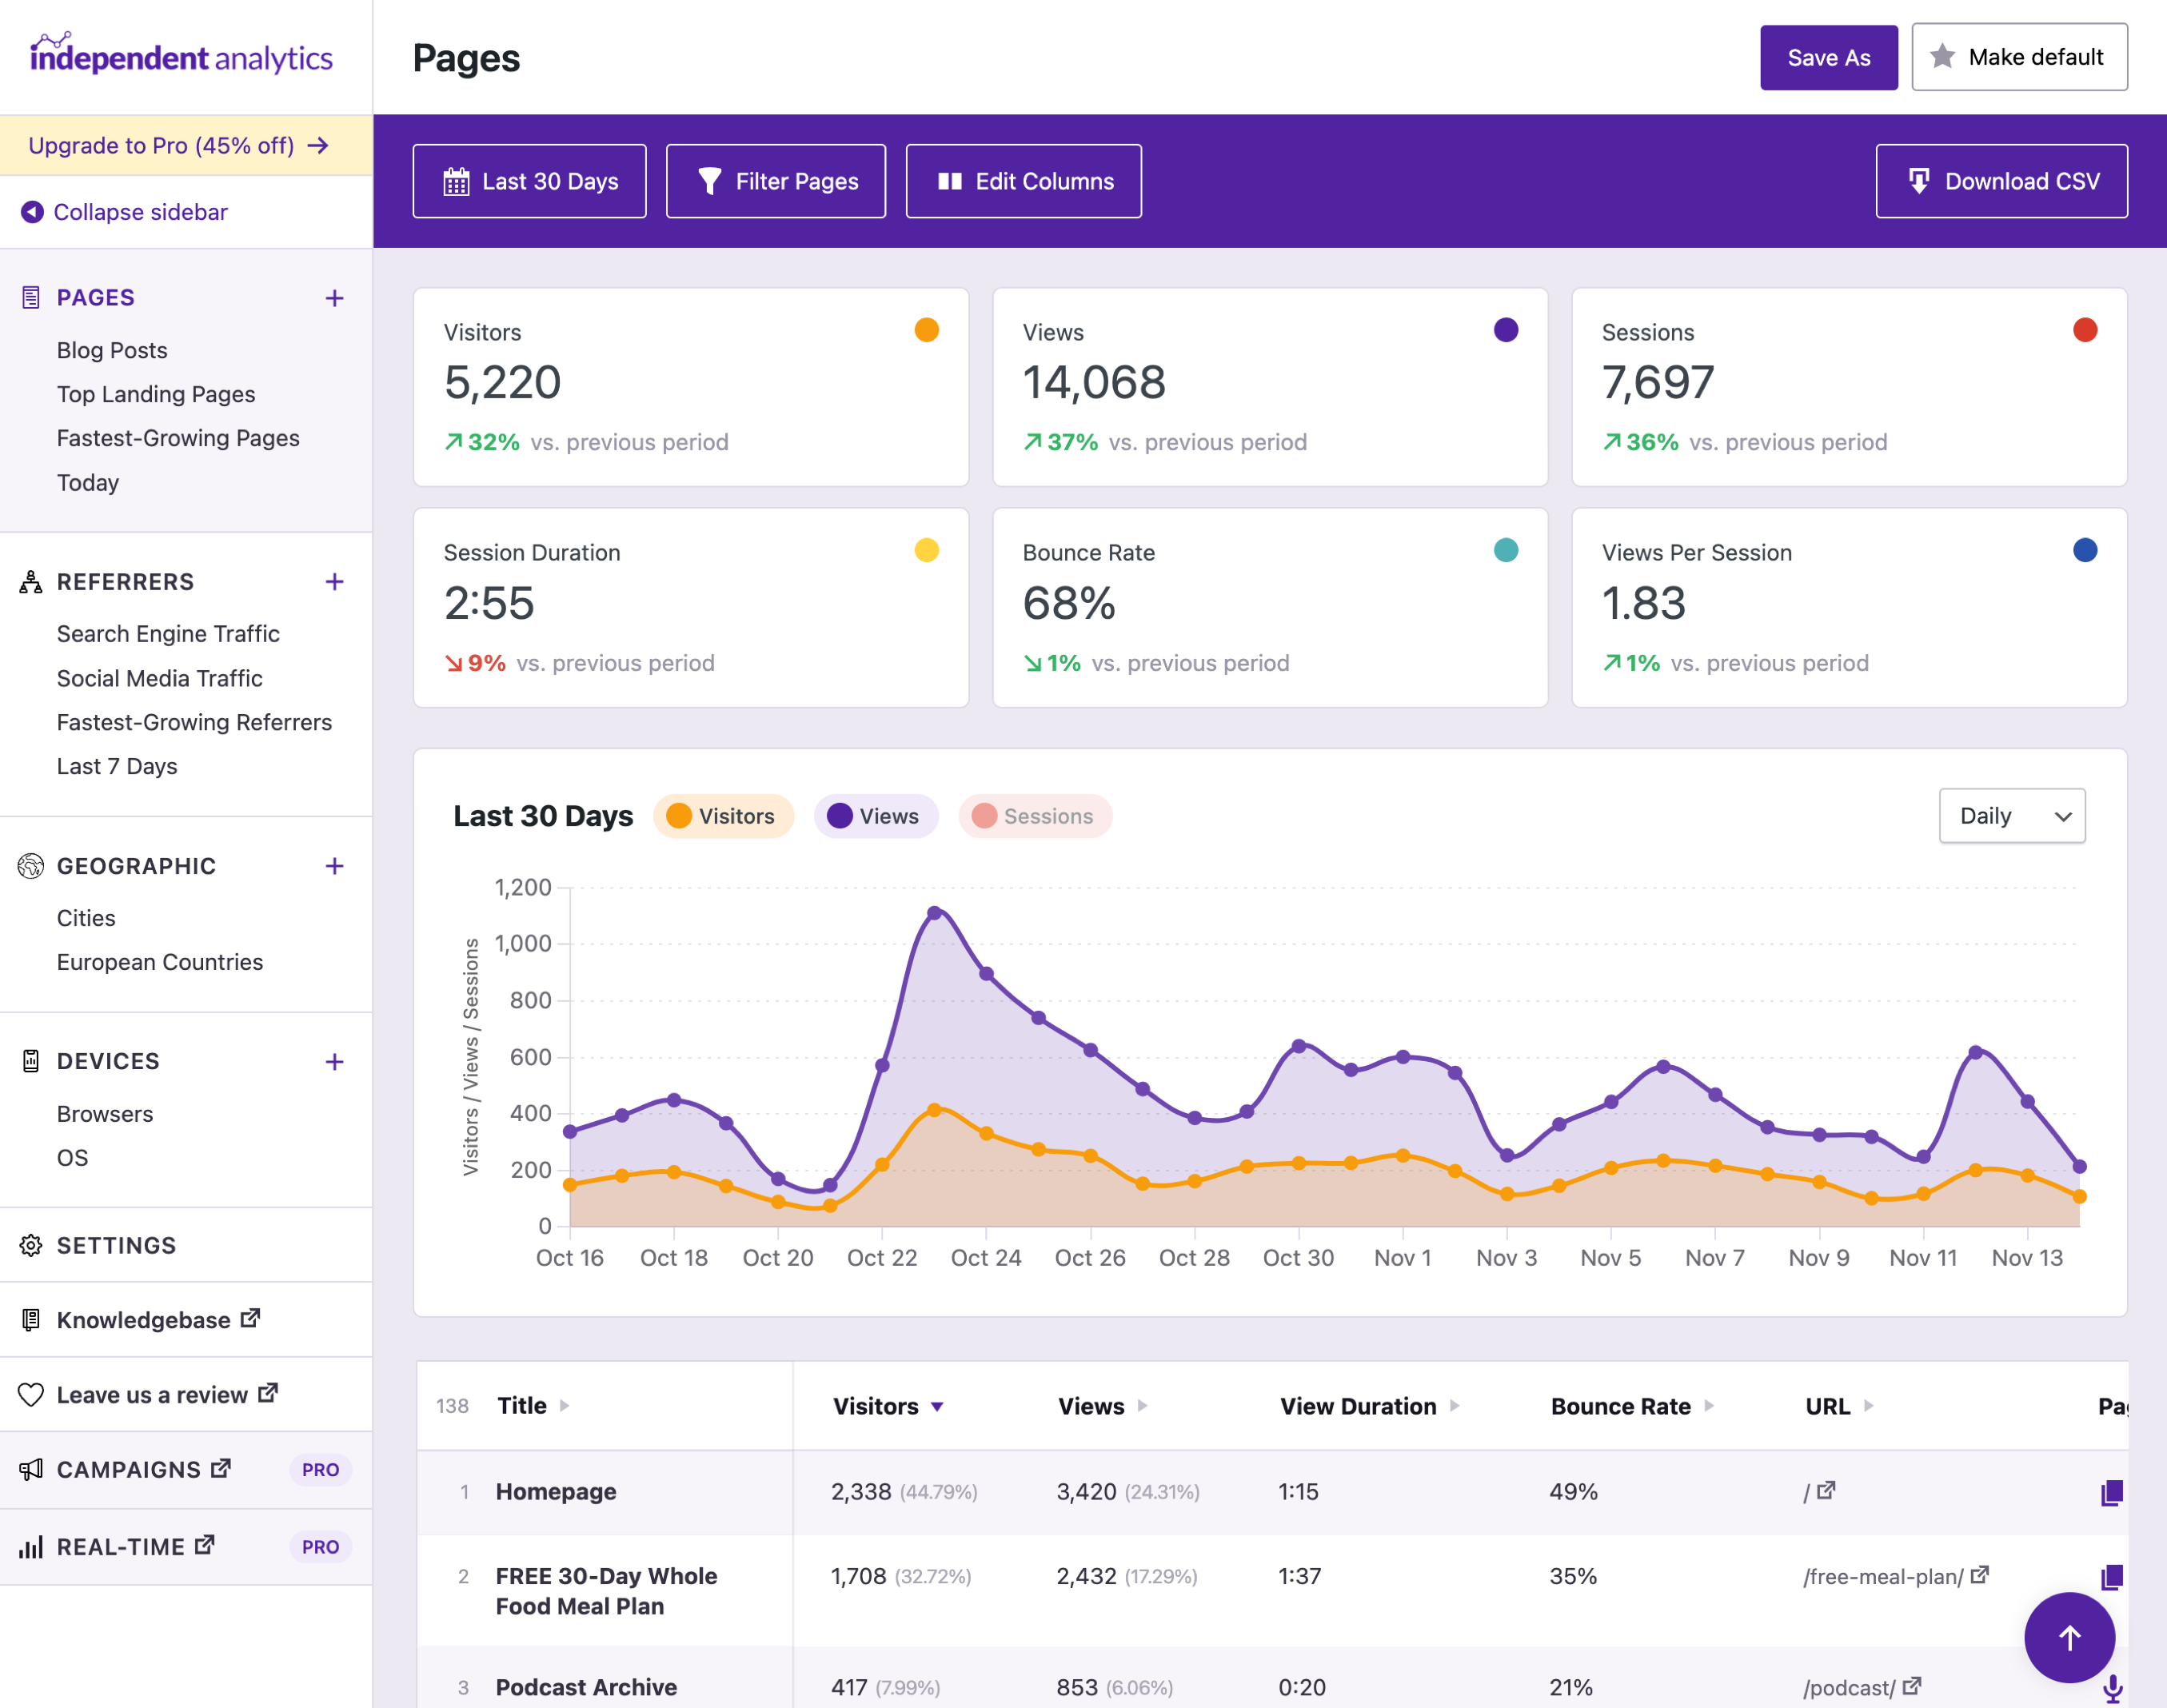
In the sidebar, you'll find the same familiar reports (Pages, Referrers, etc.), but you'll also find new sub-reports under each one. For instance, you can see a Search Engine Traffic report under Referrers.
These sub-reports use tools in IA like filters and sorting to present unique data. For example, the Social Media Traffic report has been filtered to only include traffic from social media sites.
These additional reports are practical on their own, but we haven't gotten to the good part yet.
The sub-reports are entirely custom. You can rename/edit/delete them and add as many new custom reports as you'd like.
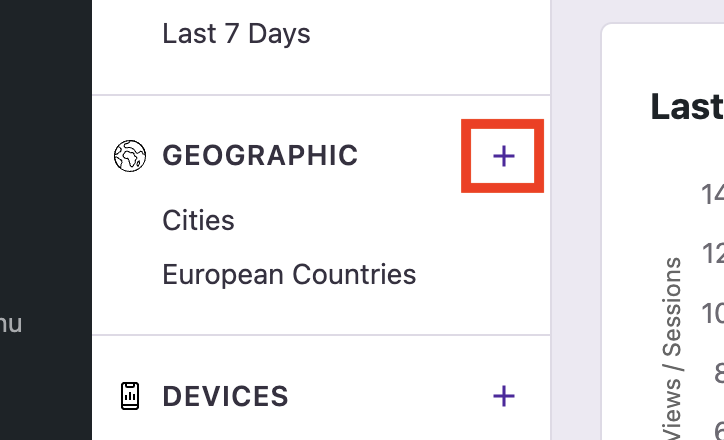
You can create a new report by clicking one of the plus buttons in the sidebar.
Then, you can give it a new title and customize the report to your liking. The report can save every change you make, including edits to the:
- Date range
- Filters
- Column visibility
- Sorting
- Grouping
- Chart metrics
- Chart interval (hourly, daily, etc.)
This allows you to create entirely custom reports and fill out the sidebar with the data that is most important for your business.
You can also use the Save As button to spin off new reports while making changes and click the "Make default" button to set any report as the default to view whenever you visit the Analytics menu.
You can also use the Save As button to spin off new reports while making changes and click the "Make default" button to set any report as the default to view whenever you visit the Analytics menu.
Export & Import Reports
If you have multiple sites with similar business goals, it'd be a pain to recreate the same reports repeatedly. That's why we've included the ability to export and import reports in the Settings menu.
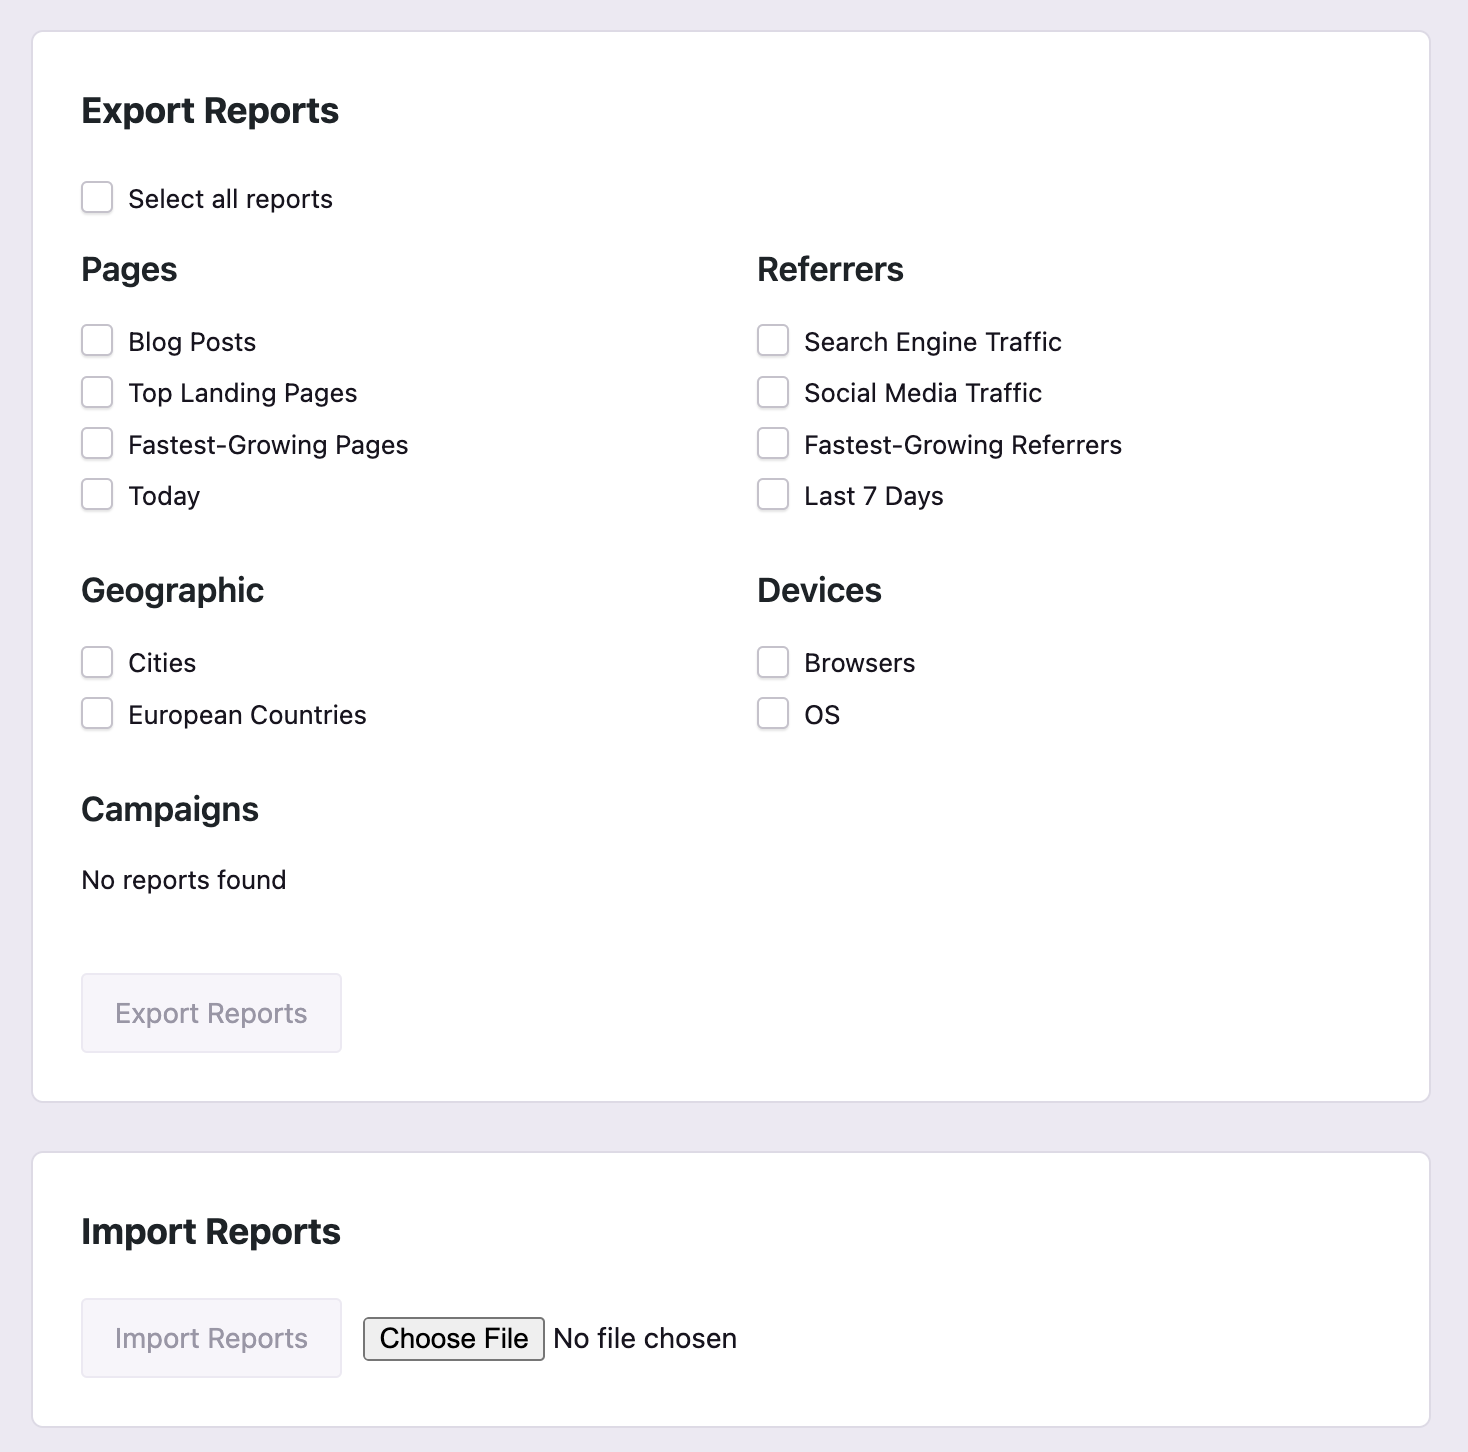
Using this feature, you can create an entire suite of custom reports and then quickly export and import them into any other site you want.
What's next?
We are really proud of this update, and we're excited to see what kind of reports everyone creates.
We want everyone to be able to take advantage of the awesome new UI, and that's why we're focusing on major performance enhancements next. It's come to our attention that the dashboard loads very slowly for sites with 100K or more visitors per month, and we'd like to change that.
The next update should create a massive difference in load times, and while this will be more evident on high-traffic websites, sites with low to moderate traffic should also notice a nice improvement in how quickly the analytics load.